EIS_XSTUDY#
About#
The eis_xstudy routine is actually a component of the EIS Planning Tool, and is used in both the construction of a timeline (eis_mk_plan) — to load something from the OSDB (official studies database) — and in eis_mk_study, used to select a study for modification in your own personal database before submission to the OSDB.To look at the OSDB, ensure that you have already run the command
print,fix_zdbase(/eis)
to instruct the planning tool to read from the OSDB. To look at your personal database instead (where you keep studies that you're designing) just replace /eis with /user in the above line.
Walk-through#
The eis_xstudy interface#
Below is an example of the widget that appears in SolarSoft when you type eis_xstudy:
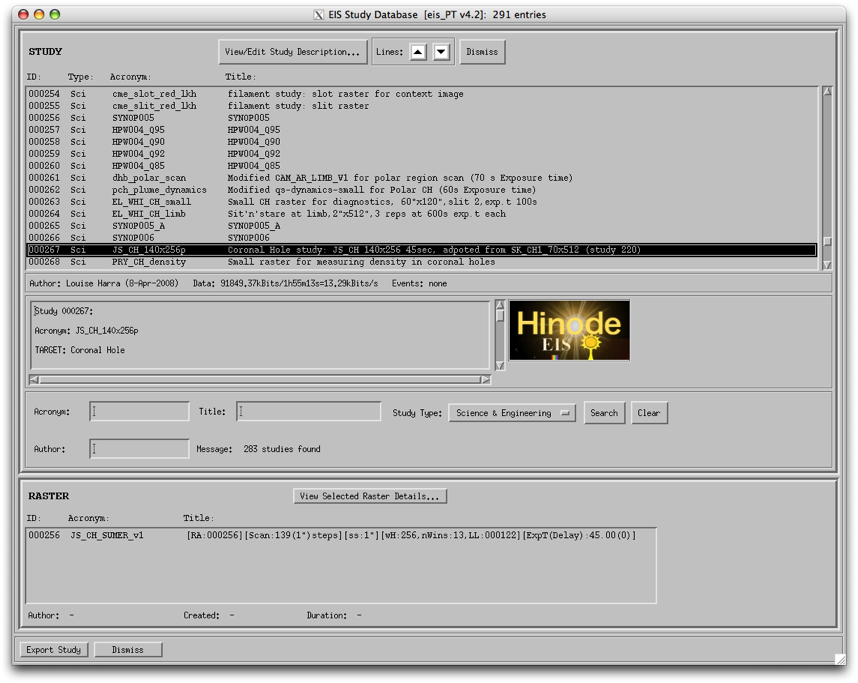 |
Study list#
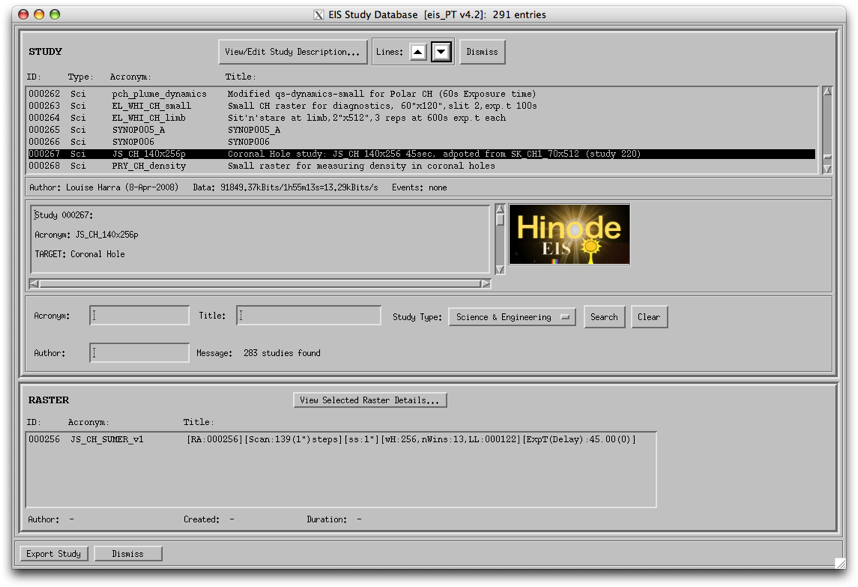
The top panel contains a list of all the studies in the database. I've cheated a little bit, in the sense that I've already scrolled down the list in the upper panel and chosen Study ID #267, the catchily-named JS_CH_140x256pAt the top of this widget there are two black triangular arrows. These can be used to reduce (down arrow) or increase (up arrow) the number of lines shown in the study list. (This can be especially useful if your screen is a lot smaller than the default widget size.) This looks like so:
 |
There's also a button at the top of the widget marked View/Edit Study Description. I'll come back to that in a while.
Information bar#
In the status bar immediately beneath the study list is a sort of information bar: here you can see important information such as the amount of data that the study is expected to generate in kbits (this is approximate, since compression factors vary a little from dataset to dataset), the duration in hours minutes and seconds (fixed, but with a little margin added), and the consequent rate of telemetry from EIS to the Hinode Data Recorder (DR).The volume here is probably one of the most important factors, since it determines how many times (if any!) a study can be run during an OP Period — see SbandObservingInfo for what this means in practice.
Study description area#
Below this information bar, there's a text area that contains the Study Description. This is information which the study author has included, indicating what they originally intended the study to be used for One of the nice things about EIS is that you can recycle a study already designed by someone else for a similar — or even different — purpose, without having to go through this design step.To read the study description in full, either scroll down this panel with the scroll bar, or go the the button at the top marked View/Edit Study Description (I told you I'd come back to it). This opens up a window like this:
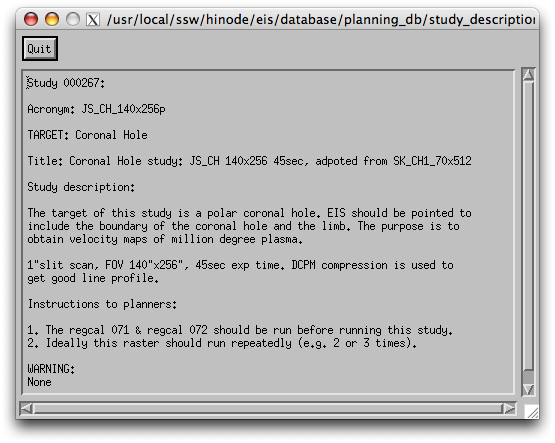 |
As you can see, the study contains information for the person using this study, if it is to be used for the original proposal.
There is also often information in the study description added by the study validator, the person who tests the study on the EIS demonstration model at MSSL, before it enters the OSDB. This information can include things like warnings — e.g., information about how not to use the study — and so on.
To get rid of this window, just click on Quit.
Search methods#
If you have some idea about the study you're looking for, e.g. it has EL in the name, or it was written by George Doschek, you can use the search facility to save you time.Below the Study Description panel, you can search on one or more fields, namely Acronym (the name of the study), Title (confusingly, a description of the study), or Author (self-explanatory). Since I've mentioned George Doschek, let's try a search for studies he's designed. I don't know any other Doscheks on the EIS team, so I'll just use his surname:
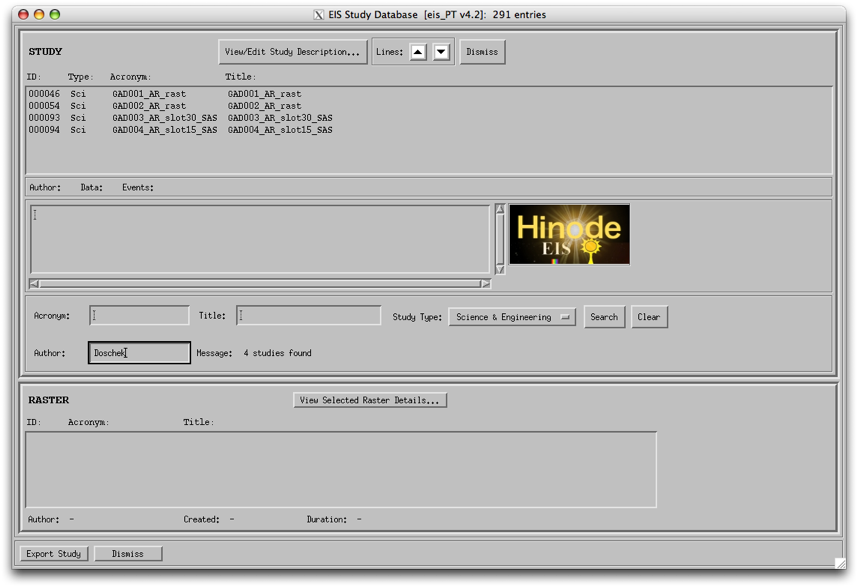 |
You can see that this results in four studies showing up, each of which was authored by someone called Doschek.
You can clear the search fields by clicking Clear on the right-hand side.
Changing the Study Type drop-down list on the right from Science & Engineering to Science excludes all engineering-type studies from our search (although this tends to be more useful when looking for specifice engineerings studies hidden amongst the forest of science studies).
Raster panel#
Below the search area is the Raster panel, where you can start to look at the details of the study's execution. Let's take another example to look at this.
For the purposes of this example, my memory's a bit shaky, so I just remember that the study I'm interested in has the letters CH in the acronym. Searching for these letters in the Acronym field produces these results:
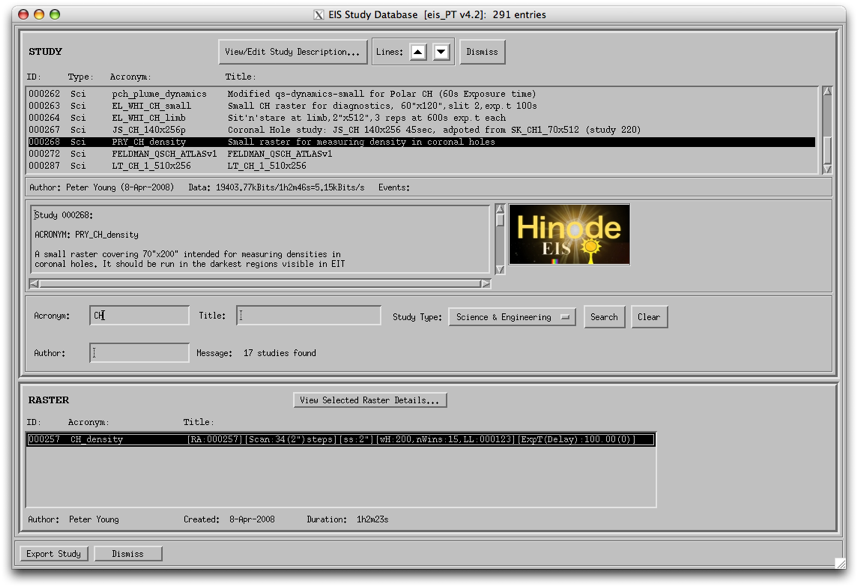 |
This also makes the raster panel go from being empty to showing the rasters in the selected study (if no study is highlighted, eis_xstudy can't know which rasters to display).
A study is essentially a package: it's an observing programme that contains a pre-defined order of executable rasters. eis_xstudy allows you to look inside this package, at the rasters that a study contains, as well as the details of those rasters. You'll see that Study #268 PRY_CH_density contains raster ID #257 CH_density. In most practical cases, studies contain only one raster. But the study is what is actually makes it onto the timeline (schedule) for EIS.
It's important not to confuse raster and study IDs when requesting observations. Please always use the Study ID or full study acronym.Viewing raster details#
If we want to see what happens when PRY_CH_density runs, the best thing to do from here is to click on each raster in the raster panel (in this case, there's only one), and then click the View Selected Raster Details... button just above.This opens up a separate window which details how the raster will execute on-board the space-craft (only omitting pointing details, which are flexible). The window should look something like this:
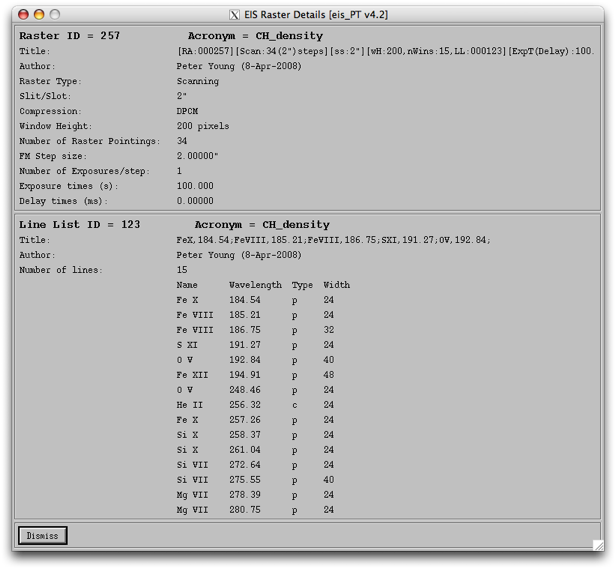 |
This is also a two-panel window. The reason for that is that, similar to the way that a study can't exist without a raster, a raster can't exist without a line list. More on that later...
The upper panel here shows the key information that we need to know about to describe the raster, namely:
| Parameter Name | value |
|---|---|
| Title | to be discussed later |
| Author | Peter Young |
| Raster Type | Scanning |
| Slit/Slot | 2" |
| Compression | DPCM |
| Window Height | 200 pixels |
| Number of Raster Pointings | 34 |
| FM Step Size | 2.0" |
| Number of Exposures/step | 1 |
| Exposure time(s) in seconds | 100.0 |
| Delay times (ms) | 0.0 |
So, what to do with all this information? Let's put it in context.
Author
The author of this raster is Peter Young. Fairly easy
Raster Type
The term raster usually conjures up the idea of a rectangular image. And that's what EIS does when it makes its observations. It's just that in some cases the X dimension is time, rather than space.
EIS has two modes of raster. The first is scanning raster, which is what we see in this example. EIS takes a restricted-field image of the Sun and then disperses it, perpendicular to the length of the slit. Then, a fine mirror (FMIR) adjusts the X position on the Sun where that image comes from (by the amount indicated in FM Step size) and makes another image. This is how EIS builds up spectroheliograms (spectral image of the Sun).
If n is the number of positions that the slit makes an image at, Σ texp is the sum of the exposure times (usually there is only one) at each position (in seconds), and xstep is the size (in arcseconds) of the step, then it takes n × Σ texp × xstep seconds to build up a spatial image of an area that is n × xstep arcseconds across.
The second mode is the so-called fixed slit or sit'n'stare raster type, whereby the same slit or slot-size portion of the Sun is repeatedly made into an image and dispersed. This is qualitatively the same as the scanning raster, except for the fact that we are usually more interested in the time-dependent changes at a particular location.
Slit/Slot
EIS makes images of different widths every time it takes an exposure (and disperses it). Slit spectra contain direct spectroscopic information, but take time to build up information over areas (see Raster Type above). For more image-based information, at the expense of line profile information, we can make slot image (scanning or sit'n'stare).
Raster Title
You can also get a quick idea of most of the characteristics of a raster from the single-string raster Title field in eis_xstudy.
Compression Type
Window Height
Number of Raster Pointings
Exposure Times
Delay Times