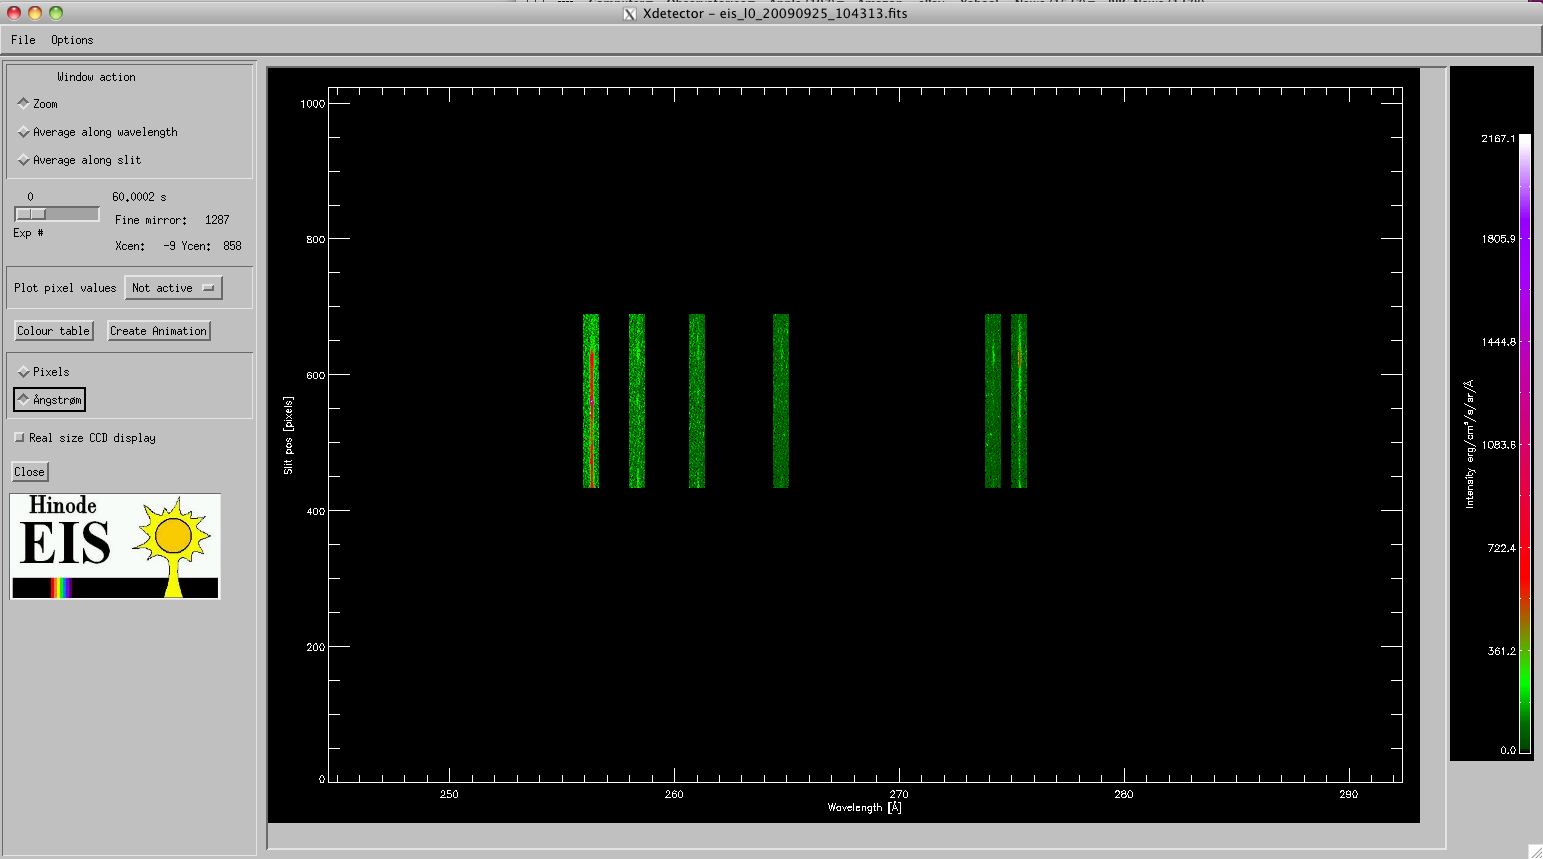
The XDetector GUI is used for viewing EIS data as detector images. If the raster contains lines on both detectors, two xdetector windows, one for each CCD will pop up. The xdetector interface will look something like the image below, where two line windows each of 256 pixels width are displayed on CCD A. This raster contains is a test pattern from negineering tests at MSSL. The abscissa in the image is wavelength (here shown as pixel numbers) and the ordinate axis is position along the slit (again in pixels). Slit position could for real data translate to Solar-Y position.
 |
The upper menu bar has to items:
- File which has to submenus:
- Save as: Use this to save CCD image as either jpg or ps file.
- Close: Use this to close the xdetector window.
- Options which has three submenus:
- Colour table: Use this to manipulate the color table of the CCD images.
- Create animation: If the raster contains more than 1 exposure, the data can be played as a movie. This is done for one line at a time, so the function requires a line selcetion, which is done in a line selection window that pops up.
- Change wavelength scale: Use this to change wavelength scale on the image from pixels to Ångstrøm or vice versa.
The left column is used for the various display functionalities available for the CCD images.
The Window action box is used to focus on a subimage of the total CCD image.
If the zoom-button is selected, a new window with a zoomed in image of the selected region appears on the screen. The zoom-region appears on the original xdetector image as a box, which is selected using the left mouse button in the image. The magification is presented in a separate window, and again there is a menu in this window to save the magnified image as jpg or ps.