The whisker display is selected from the XCONTROL display mode menu. whisker images shows line countrates as a function of wavelength (abscissa) and exposure number - time or solar-x - (ordinate). In a sit-ant-stare campaign the ordinate axis will be time, and for a scanning raster the ordinate axis will be solar-x position.
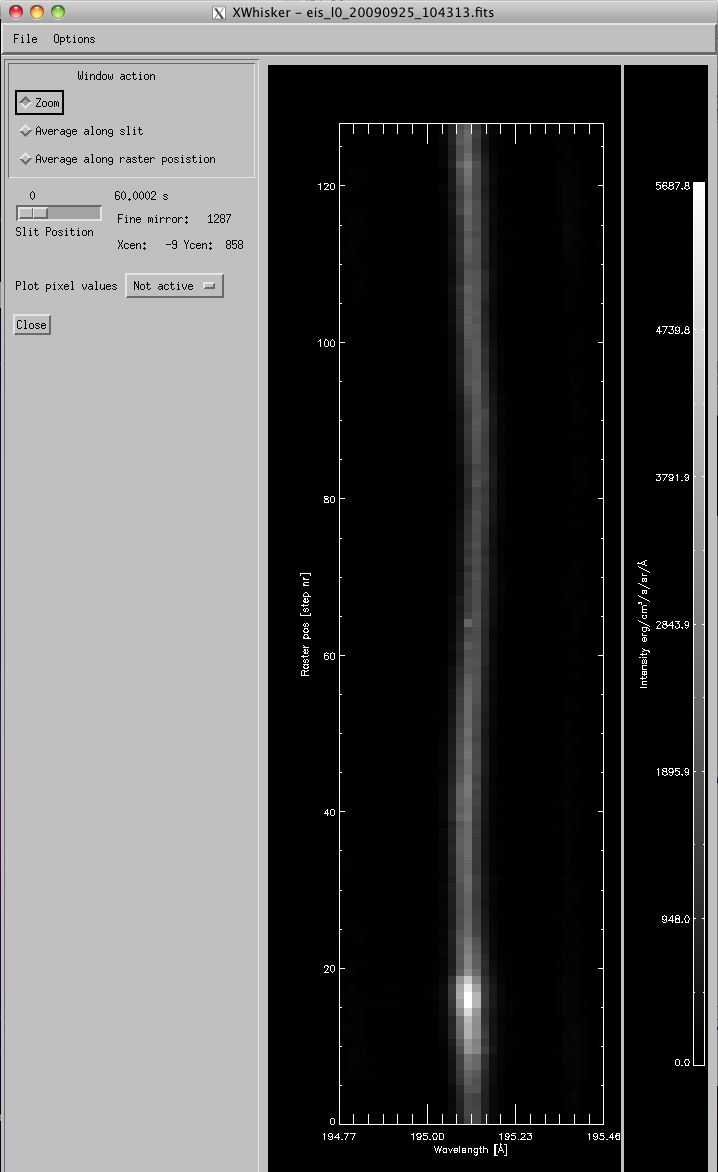 |
The image then is for one specific slit position. Such images have proven in the past to be particularly useful for sit-and-stare raster, where the time evolution of the line at one position on the sun becomes evident. The image below displays a whisker plot for a line consisting of 100 exposures. There are no velocities in these artificial data, in real data, velocities would show up as horisontal "whiskers" - therfore the naming of this display mode.
The menus available to this mode of display are the similar as those described for the xdetector display.
