Spatial offset of velocity features relative to intensity features#
A striking feature of velocity maps obtained from EIS is that regions of strongest redshift or blueshift are often spatially offset from regions with the highest intensity. This is illustrated in the example below showing a pair of coronal loop footpoints observed in the Fe VIII 185.21 line.
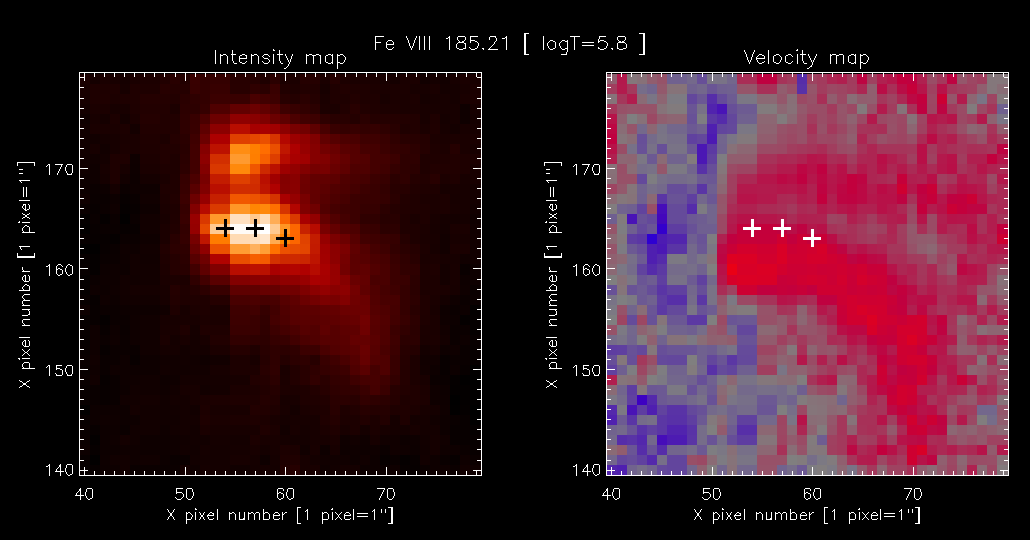
The velocity map shows structures that clearly correspond to the intensity structures, suggesting the loop footpoints are redshifted. Three crosses have been placed on the intensity map at where the intensity peaks in the Y-direction. It is seen, however, that the positions of the crosses on the velocity map do not correspond to where the redshift is largest.
While this may seem to be an interesting physics result, evidence from velocity maps of a range of different solar structures suggests that this intensity-velocity spatial offset is actually an instrumental effect. To state the effect simply:
"Wherever there is a decreasing intensity gradient from north to south, the centroid of the emission line will be artifically shifted to longer wavelengths (redshift); and wherever there is a increasing intensity gradient from north to south, the centroid of the emission line will be artifically shifted to shorter wavelengths (blueshift)."
A similar phenomenon was observed in SOHO/CDS data and was explained by Haugan (1999) as being due to an "elliptical, tilted point spread function".
To state the observed effect simply, wherever there is a decreasing intensity gradient from north to south, the centroid of the emission line will be artifically shifted to longer wavelengths (redshift); and wherever there is a increasing intensity gradient from north to south, the centroid of the emission line will be artifically shifted to shorter wavelengths (blueshift). Observations of polar coronal holes provide another illustration of the effect that is apparent due to limb brightening in coronal lines. Tian et al. (2010) presented velocity maps of the north polar hole obtained with EIS where a distinctive ridge of redshifts is found along the limb in the Fe xii λ195.12 and Fe xiii λ202.04 emission lines. This arises because there is a decreasing intensity gradient from north to south at the limb. Inspection