Increasing solar activity during 2011
2011 saw a dramatic upturn in the sunspot number with a corresponding increase in solar flare activity. This included the first X-class flare of the current solar cycle (cycle 24) which occurred on 15 February 2011. As of the time of writing, a total of eight X-class flares have occurred during 2011. Two of these X-class flares were located in NOAA active region 11302 and careful planning of the EIS observation timeline led to the latter X-flare being observed by EIS. Active region 11302 rotated over the Sun's East limb on 12 September 2011 and rapidly grew to become a
beta-gamma-delta region.
X-flare on 24 September 2011
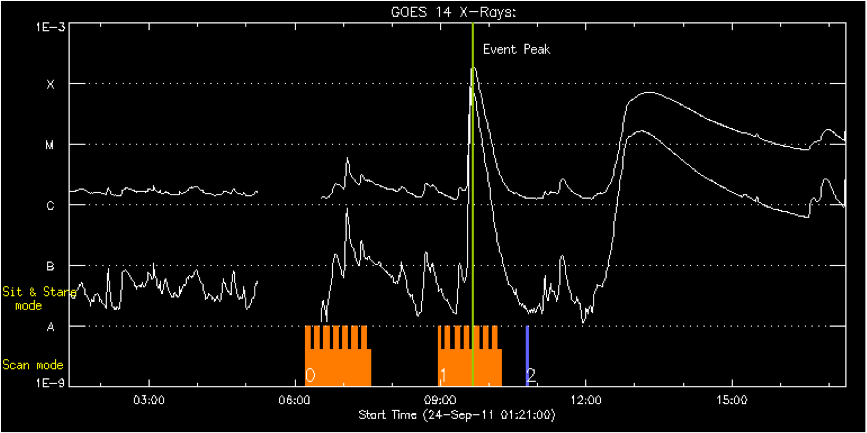
On 24 September 2011 active region 11302 produced a X1.9 GOES class flare which peaked around 09:20 UT and had an associated eruption.
During 24 September 2011 EIS was running a 2" slit study (study ID 390; HH_Flare_180X160_v2). This study was chosen so that it could be run rapidly over active region 11302 thoughout the day to increase the chance of catching flare activity. The exposure time was 8 seconds and the slit was moved across the region to build up an image using the 'sparse' raster technique. A sparse raster is the result of a slit observation (made here with the 2" slit) and followed by a slit movement greated than the slit size (here a 5" shift in pointing) to the East before the next slit observation is taken. In this data-set, images have been built up where the 2" observations are interspersed with 3" gaps with the benefit being that it takes very little time to image the entire active region.
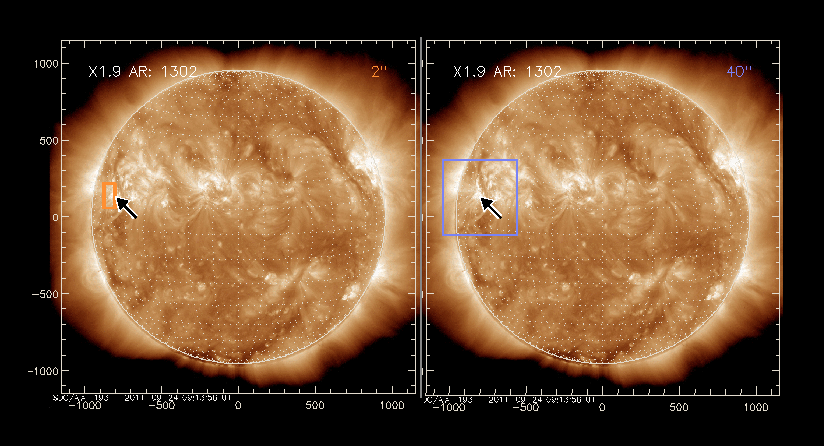
EIS slot observations were also taken during the decay phase of the flare (study ID 353; PRY_slot_context_v3). The figures below show the GOES soft X-ray light curve over-plotted with the times of the EIS slit and slot observations and the pointing of EIS during these observations. Orange indicates slit observations and purple indicates slot observations and the figures are taken fron the
EIS flare catalogue where the EIS data for this flare can be obtained.
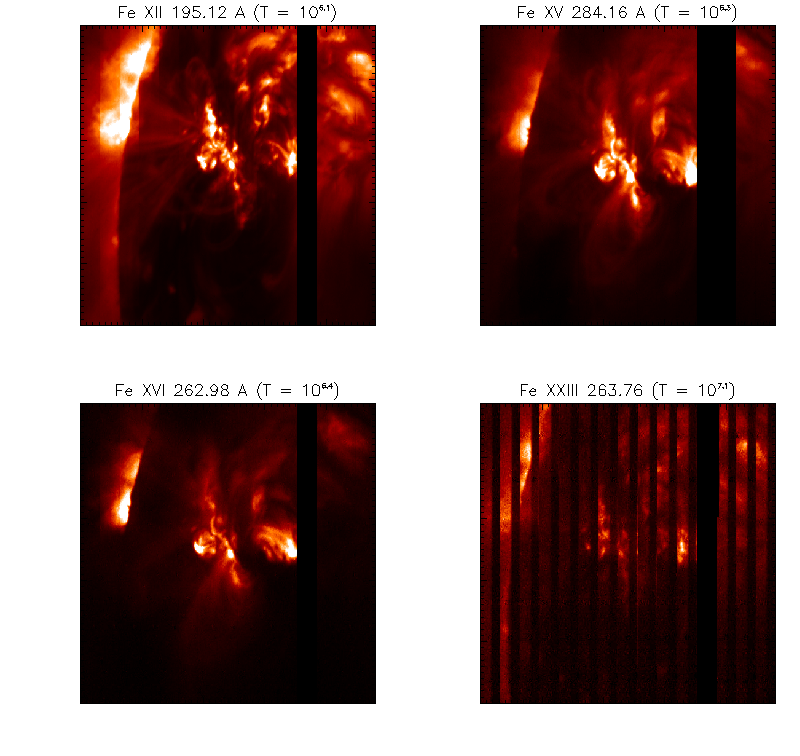
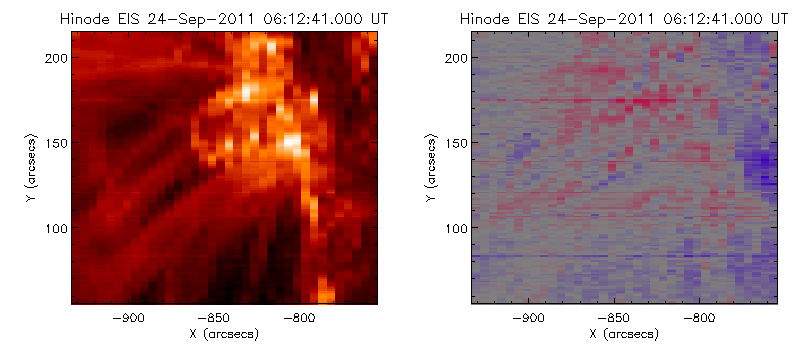
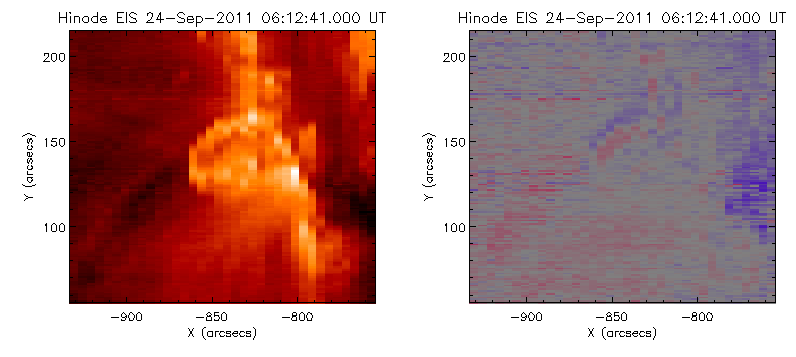
A wonderful data-set was obtained for this flare which covered the time before, during and after the flare. To see what EIS observed during the flare rise phase in the Fe XV 284.16 Å and Fe XII 195.12 Å lines please view the movies below. The left-hand panels show EIS intensities and the right-hand panels the EIS velocities (blue represents material moving toward the observer and red shows material moving away). The data have been prepared so that the gaps in the EIS sparse raster are filled to make the coronal structures easier to determine.
Fe XII movie: intensity (left) and velocity (right). Click figure to download the movie
Fe XV movie: intensity (left) and velocity (right). Click figure to download the movie
The EIS 40" slot images were taken during the decay phase of the flare using a 32" scan step size and a 10 second exposure time (see image below).
The details of the slit observations are (study ID 390; HH_Flare_180X160_v2):
| Lines | Wavelength (Å) | Temp (log T[K]) |
| OVI | 184.12 | 5.5 |
| FeX | 184.54 | 6.0 |
| FeXXIV | 192.03 | 7.2 |
| FeXII | 195.12 | 6.1 |
| FeXVII | 254.87 | 6.6 |
| Fe XVI | 262.98 | 6.4 |
| FeXXIII | 263.76 | 7.1 |
| FeXIV | 264.79/274.20 | 6.3 |
| FeXV | 284.16 | 6.3 |
The details of the slot observations are (study ID 353; PRY_slot_context_v3):
| Lines | Wavelength (Å) | Temp (log T[K]) |
| Fe XI | 180.40 | 6.1 |
| Fe XII | 195.12 | 6.1 |
| Fe XIII | 202.04/203.83 | 6.2 |
| HeII | 256.32 | 4.7 |
| FeXVI | 262.98 | 6.4 |
| FeXXIII | 263.76 | 7.1 |
| MgVI | 268.99 | 5.7 |
| SiVII | 275.35 | 5.8 |
| FeXV | 284.16 | 6.3 |