One of the interesting things we're able to do with EIS is to examine line profiles in the corona. In addition to the information gained from the total intensity of the line, and the centroids of whatever Doppler components are present, the width of the line can be a source of useful information, too.
As I mentioned in the first of these nuggets
The Weird and Wonderful World of Widths, the Doppler motions due to a thermal (Maxwellian) distribution of particle velocities, at what we believe to be the line's formation temperature, rarely makes the line as wide as observed, even when you take into account instrumental broadening. Since that nugget, Peter Young came up with a characterisation of that instrumental width (as FWHM in Angstoms), which you can plot for yourself in SolarSoft, as a function of slit position (south to north) :
IDL> plot,eis_slit_width(indgen(1024))
Since non-thermal width has been looked at with various spectrometers in the last few decades, we can take a look at how the measurements match up against those older measurements. With EIS, we've already learnt that apparent non-thermal width goes up in regions of Doppler blue-shift near the edges of active regions, and that the correlation between the two parameters is generally a positive one. But what hasn't really been looked at systematically is how this varies with temperature. Some pre-Hinode observations had either much worse or zero spatial resolution, but they did look at the temperature behaviour of non-thermal velocity.
We've been interested primarily in active region data, since that's where most of the discussion on non-thermal widths has been, but for a sanity check, we've also taken samples from the quiet Sun. The AR_velocity_map_v2 has a large number of lines in it, including the more recently identified lines of Fe IX, so we planned to cover the spectrum from Fe VIII to Fe XV in the quiet Sun, and from Fe IX in active regions, trying to stick to clean lines where possible. And to compensate for the fact that width measurements are noisier than centroid or intensity measurements, we've summed up the spectral emission in boxes of 10" x 10" around key features in both the AR and QS data. To compare with historical results, we've also gathered what we consider a representative sample of data taken on both active region and quiet Sun targets. Figure 1 shows the quiet Sun raster we analysed, with boxes on a map of Fe XII 195.12 intensity.
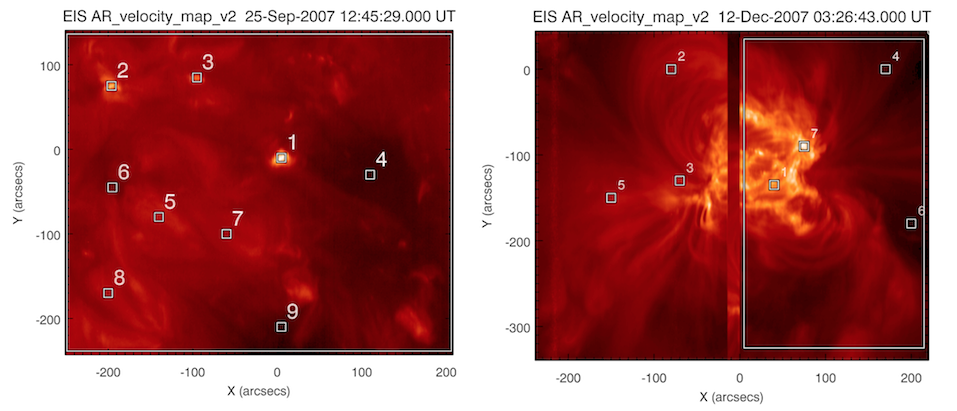
Figure 1 - Figure 1: Maps in Fe XII 195.12 intensity (a line not used in our analysis). Left: map of a disc-centre quiet Sun raster, with sample boxes. Right: an active region dataset with sample boxes. In each case the largest box shown is Box 0.
You can see that we've selected 9 small boxes, and there's also a tenth box (Box 0) that includes the whole area, so that we can look at average properties. Boxes 5 thru 8 are in regions of what you might call typical quiet Sun: they're not bright points and they're not coronal hole. Boxes 4 and 9 do seem to be in coronal hole regions, and boxes 1, 2 and 3 were chosen to represent quiet Sun bright points.
If we plot the data from typical quiet Sun on the same axes as the historical data, you can see that they broadly follow the same shape as the SUMER results of Chae et al. (1998) and Peter (2001), although they're a little above those results, which is curious. Also interesting is that the Hara (1996) results, which were taken from a non-flaring active region by a well calibrated, ground-based coronagraph, lie below the disc-centre quiet Sun points from EIS.
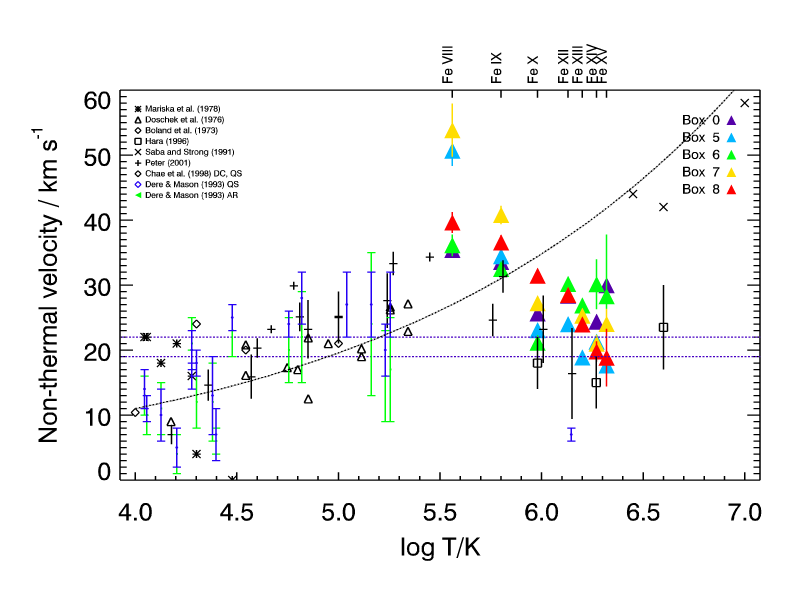
Figure 2: Historical and present results of derived non-thermal velocity from a selection of the literature. The upward curve matches that from Hara (1996) and passes through the high-temperature AR results of Saba & Strong (1991). The two horizontal dashed lines are the "catch-all" limits given by Coyner & Davila (2011).
What do agree well with Hiro Hara's thesis measurements, though, are the widths measured in loops that extend way out from the active region core (boxes 4 and 5 in the Figure 1 (AR); Figure 3), and this is fairly satisfying: the Hara measurements were taken in loops like this, albeit at the limb in his case, so we're comparing like with like.
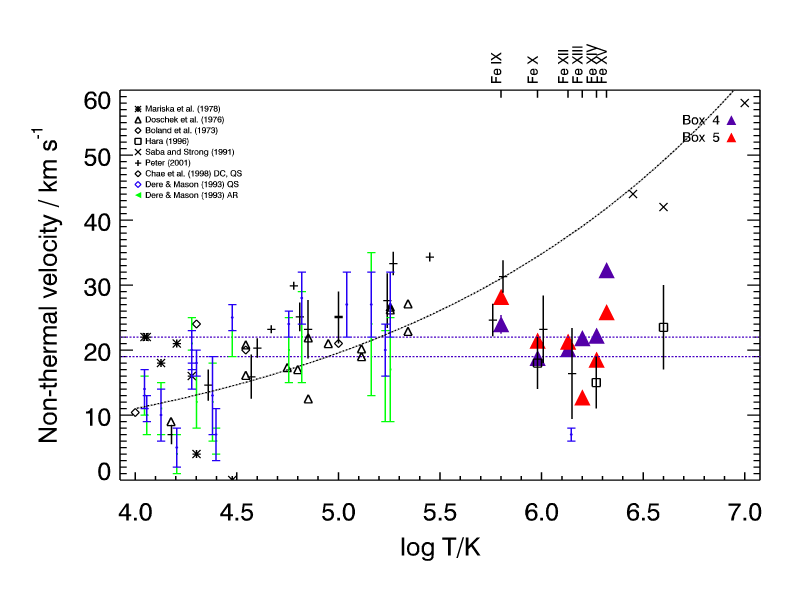
FFigure 3: The results taken from long, non-flaring loops in our Figure 1 (right) compare well with those of Hara (plotted as open boxes).
Buoyed up with a little confidence that our measurements are sane, we then look at the difference between the outflow areas and the closed loop structures in the northern part of the AR. Here you can see that the regions of strongest outflow (like Box 3) show enhanced non-thermal velocity with respect to a region further out (6) and even more so compared with a non-outflow, closed loop structure (2), but that in all cases, there is a clear trend for this parameter to increase with temperature. Most intriguingly, the T^ (1/4) line drawn by Hara continues up to the results of Saba & Strong, by way of these points in the outflow regions. It's almost as though there's an active, power-law curve (EIS data in Figure 4), and a quiescent curve that turns over in temperature somewhere around log T = 5.6 (our data in Figure 1). This may hold clues, about either the energetics of the plasma, or the heterogeneity of what we see along the line of sight or both.
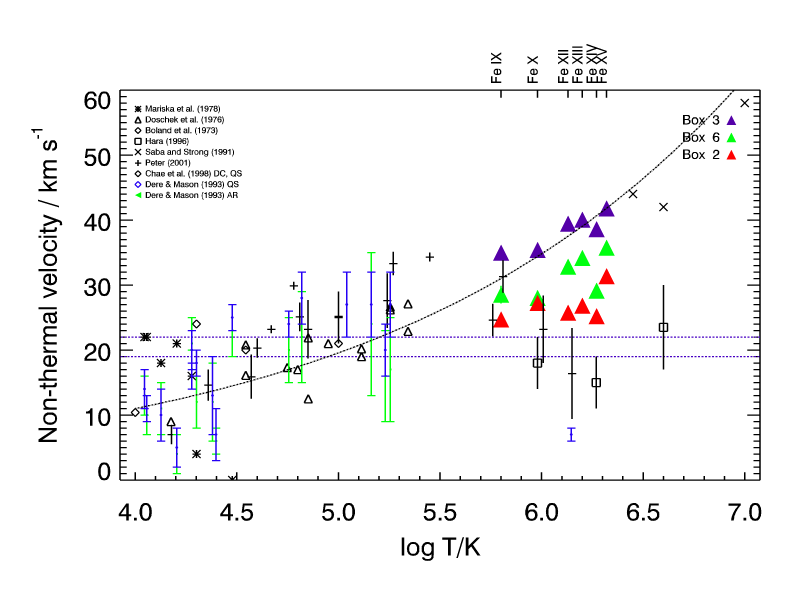
Figure 4: A strong upward trend of non-thermal velocity with temperature is now seen when we look at lines from Fe IX to Fe XV in the corona.
References:
Boland et al. The Heating of the Solar Corona. I. Observation of Ion Energies in the Transition Zone. Astronomy & Astrophysics (1973) vol. 22 pp. 161
Chae et al. SUMER Measurements of Nonthermal Motions: Constraints on Coronal Heating Mechanisms. The Astrophysical Journal (1998) vol. 505 pp. 957Coyner and Davila. Determination of Non-thermal Velocity Distributions from SERTS Linewidth Observations. The Astrophysical Journal (2011) vol. 742 pp. 115
Dere and Mason. Nonthermal velocities in the solar transition zone observed with the high-resolution telescope and spectrograph. Solar Physics (1993) vol. 144 pp. 217
Doschek et al. The emission-line spectrum above the limb of the quiet sun - 1175-1940 A. The Astrophysical Journal Supplement Series (1976) vol. 31 pp. 417
Hara. Structures and heating mechanisms of the solar corona. PhD thesis. Natl. Astronom. Obs., Japan.(1996)
Lee et al. Hinode/EIS observations of ion kappa distributions in active regions of the solar corona. Astronomy & Astrophysics (2012), in review.
Mariska et al. Measurements of extreme-ultraviolet emission-line profiles near the solar limb. The Astrophysical Journal (1978) vol. 226 pp. 698
Peter. On the nature of the transition region from the chromosphere to the corona of the Sun. Astronomy & Astrophysics (2001) vol. 374 pp. 1108
Saba and Strong. Active region mass motions observed in soft X-ray lines. (Solar corona and solar wind; Proceedings of Symposium 9 of the 28th COSPAR Plenary Meeting (1991) vol. 11 pp. 117
Williams et al. The thermal and spatial distribution of non-thermal velocities in solar active regions. Astronomy & Astrophysics (2012), in preparation.


