Using EIS to measure the coronal magnetic field
by David Long (UCL/MSSL), David Williams (UCL/MSSL), Stéphane Régnier (UCLan), Louise Harra (UCL/MSSL)

Although the Sun's magnetic field is responsible for much of the activity that makes the Sun such an interesting star, it continues to be difficult to accurately estimate its strength in the low corona. This can be done using Zeeman splitting (cf. Lin et al., 2004) or the Hanle effect (cf. Raouafi et al., 2002), but this is generally only possible near active regions where the magnetic field strength is high. In quieter regions, the lower magnetic field strength can be inferred by examining variations in how global coronal waves (commonly called "EIT Waves") propagate through the corona, a technique called coronal seismology (e.g., Uchida, 1970, Roberts et al., 1984, West et al., 2011).
"EIT Waves" are large-scale global perturbations travelling at velocities of up to 1000 km/s that can traverse the Sun in less than an hour. Originally discovered using SOHO/EIT (Thompson et al., 1998), they have been variously interpreted as fast-mode magnetohydrodynamic waves or the signature of magnetic reconnection as a CME erupts into the heliosphere. Recent results by Warmuth & Mann, (2011) have suggested that the pulse velocity may indicate its physical nature, with faster pulses consistent with a MHD wave interpretation while pulses exhibiting irregular kinematics are more consistent with the "pseudo-wave" interpretation.
In Long et al. (2013) we estimate the magnetic field strength of the quiet solar corona by combining high cadence images from SDO/AIA with high-resolution spectra from Hinode/EIS. These results are then compared to magnetic field extrapolations to determine the height-range of the feature.
Events and Analysis
Two "EIT Wave" events observed by Hinode/EIS from 12-June-2010 and 16-February-2011 were analysed for this work (see Figure 1 and the online difference movies at http://www.mssl.ucl.ac.uk/~dml/nugget/). "EIT Waves" are quite rare events and as events observed using a spectrometer, the 12-June-2010 event had been previously studied by Chen and Wu (2011) while the 16-February-2011 event had been studied by both Harra et al. (2011) and Veronig et al. (2011). Whereas previous work had focussed on the pulse, here we concentrate on the background corona, using the variation in propagation of the pulse to examine the plasma properties of the quiet coronal region through which the pulse passes.
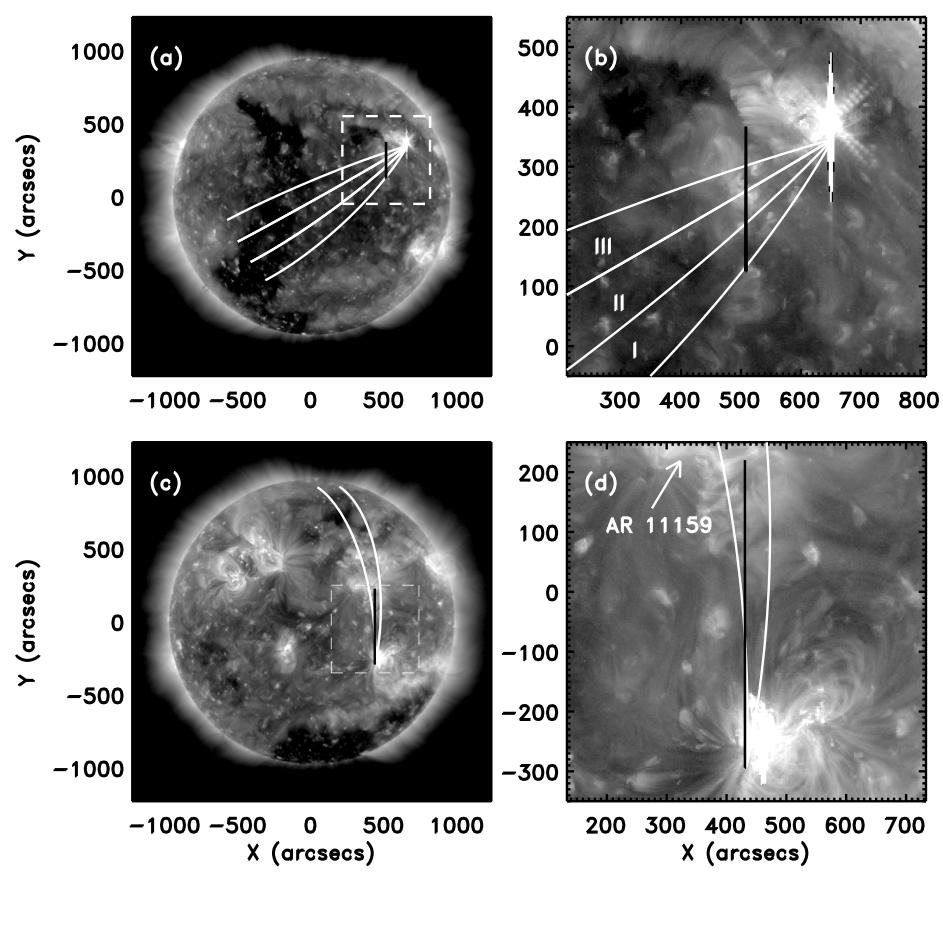
Figure 1: SDO/AIA 193A images showing the events from 12-June-2010 (t= 00:58:30 UT; full-disk in panel (a) and zoomed-in in panel (b)) and 16-February-2011 (t = 14:25:31 UT; full-disk in panel (c) and zoomed-in in panel (d)). The great-circle arc sectors used to determine the kinematics of the pulses are shown bounded in white, while the Hinode/EIS slit positions are in black in all panels. The arcs in panel (b) are labelled I, II and III for easier identification throughout the text.
The kinematics of the pulse were estimated using the automated wave detection algorithm CorPITA (previously discussed by Long et al. 2011a,b). This algorithm uses an intensity profile technique applied to 36 individual arcs of 10 degree width on the solar surface to identify and track the propagating "EIT Wave" in SDO/AIA data. It is fully automated, requiring only the flare start time and flare location as an input to ensure consistent measurement of the distance propagated by the pulse from some point. This allowed the pulse kinematics to be measured (see Figure 2) for each of the arcs shown in Figure 1.
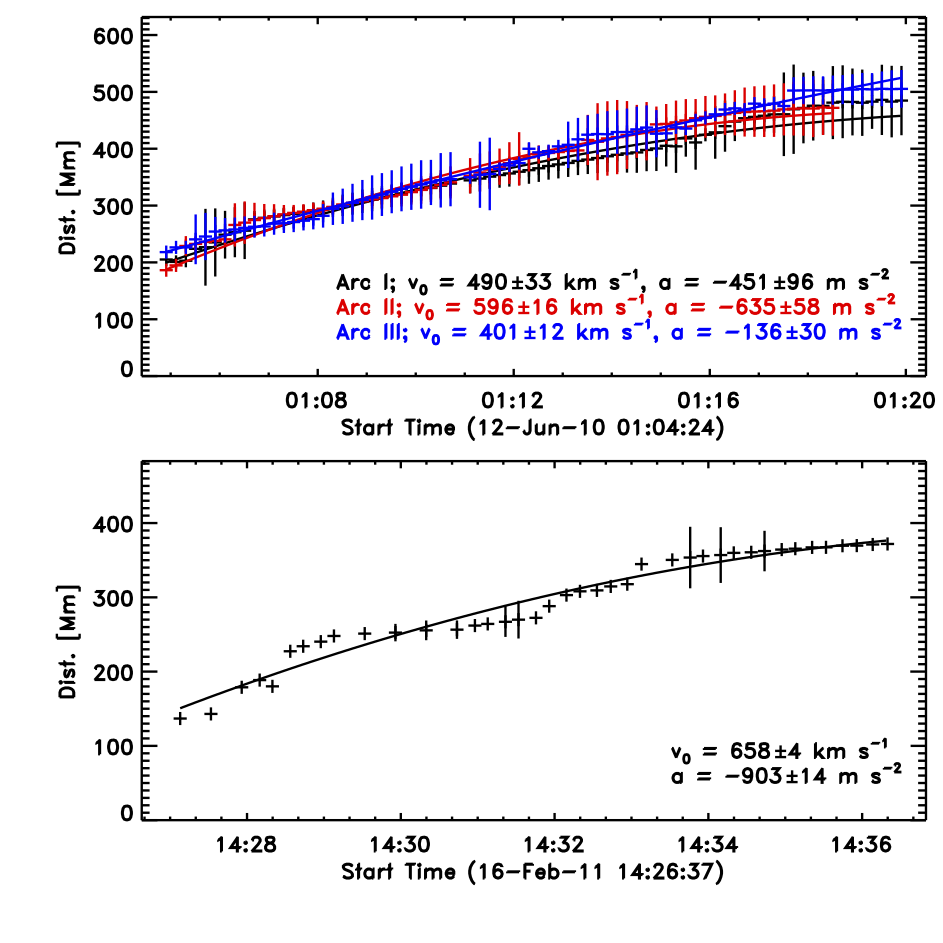
Figure 2: Time-distance plots for the events of 12-June-2010 (top) and 16-February-2011 (bottom). The kinematics derived for each of the arcs I, II and III for the 12-June-2010 and 16-February-2011 "EIT waves" are given in the respective legends.
Density-sensitive line ratios observed by Hinode/EIS were used to determine the density of the quiet corona through which the pulse propagated for each event (see Figure 3). Both of the pulses studied exhibited kinematics consistent with that of a fast-mode MHD wave, so from the definition of the fast-mode wave speed it was possible to estimate the magnetic field strength B given the pulse velocity v and the density n. The results of this approach are shown in Figure 3 for the event from 12-June-2010, where the magnetic field strength can be seen to vary between 2 and 8 Gauss for the events studied.
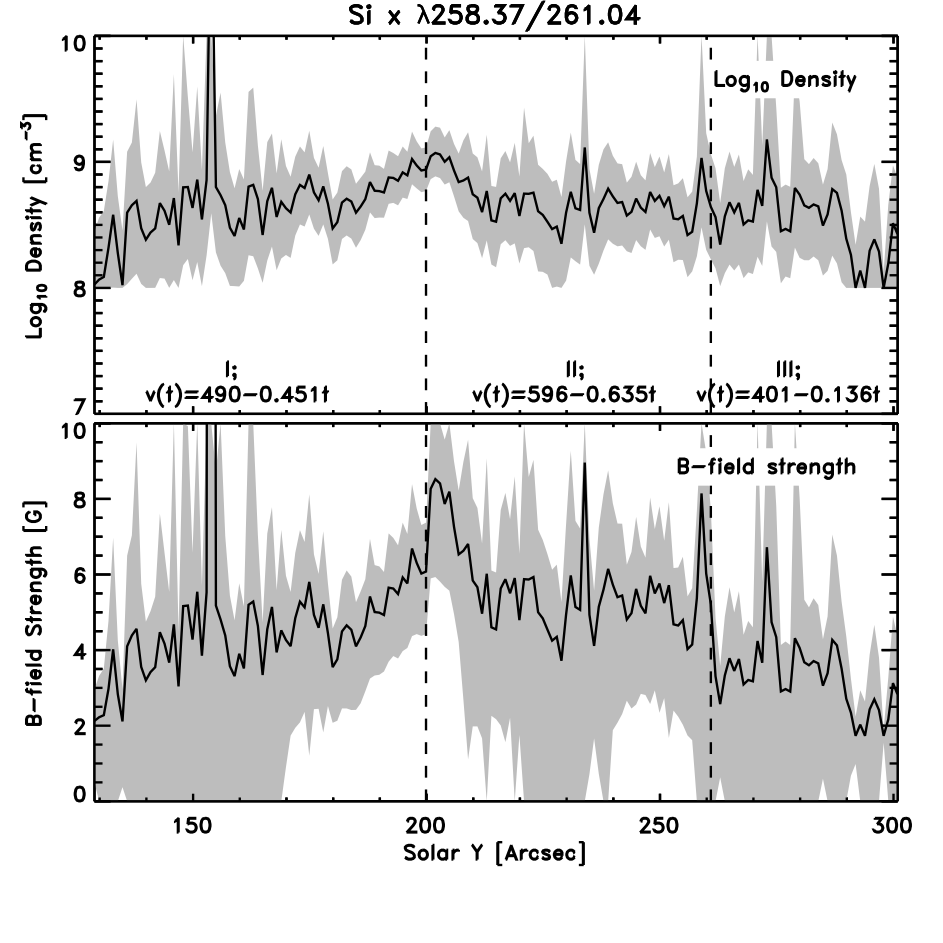
Figure 3: Variation in number density (top panel) and magnetic-field strength (bottom panel) with position for the 12-June-2010 event. The sections delineated by the vertical lines correspond to arc sectors (from left to right) I, II and III respectively while the error associated with each parameter is indicated by the grey shaded region. The density variation for this event was determined using the Si X 258.37/261.04A density-sensitive line ratio.
Discussion and Conclusions
Having estimated the magnetic field strength from observations, these results were compared to local-domain (cf Régnier, Priest and Hood) and PFSS magnetic field extrapolations. By examining the fall-off in magnetic field strength with height above the slit observed by Hinode/EIS using both approaches it was possible to estimate the height of the pulse. This is shown in Figure 4 for the PFSS technique and Figure 5 for the local domain method.
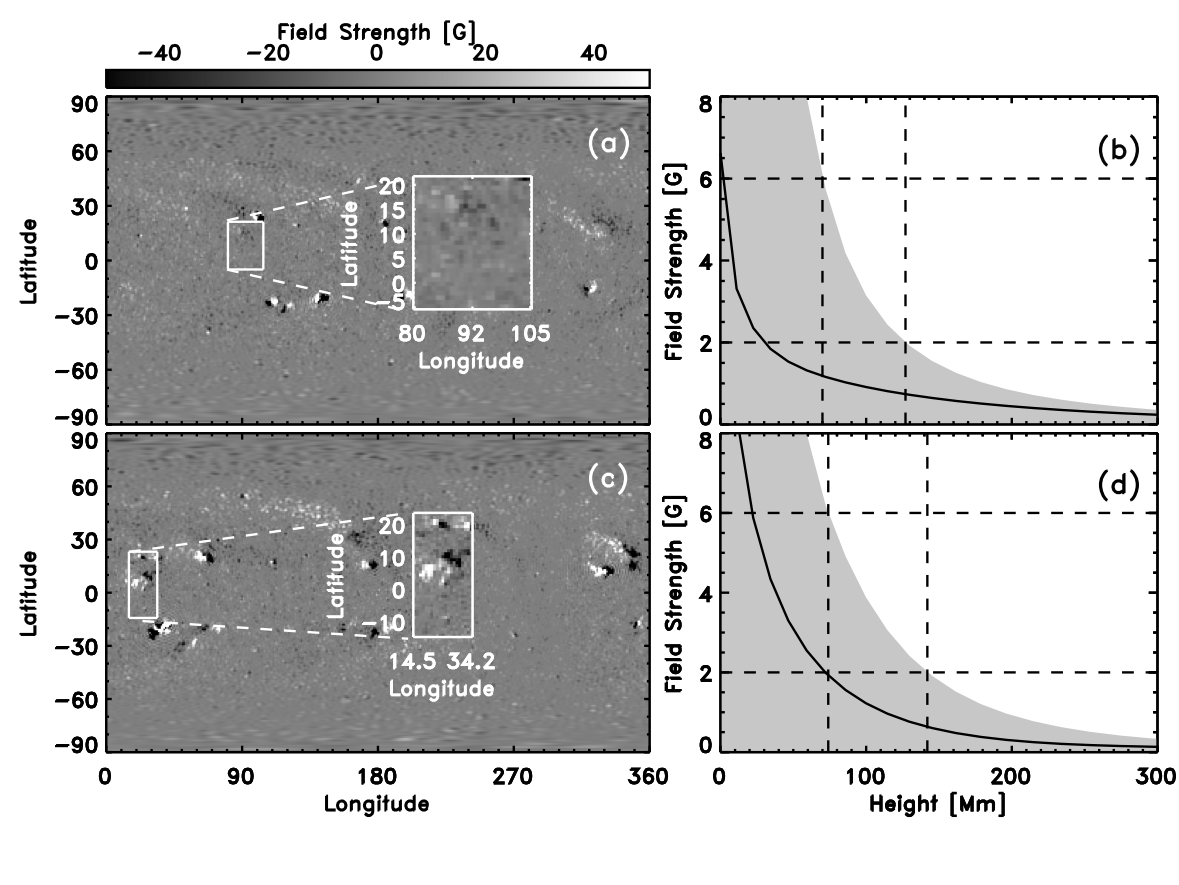
Figure 4: Synoptic maps from 12-June-2010 (panel (a)) and 16-February-2011 (panel (c)) used as a boundary condition for the PFSS model. The white box and enlarged section indicate the area in which the average magnetic field strength is computed. The corresponding average field strength as a function of height in the corona is shown in panel (b) for the event of 12-June-2010 and panel (d) for the event of 16-February-2011. The grey area shows the spread of the magnetic-field strength. The vertical dashed lines indicate the height at which a maximum field strength of 6 G and 2 G is achieved (horizontal lines).
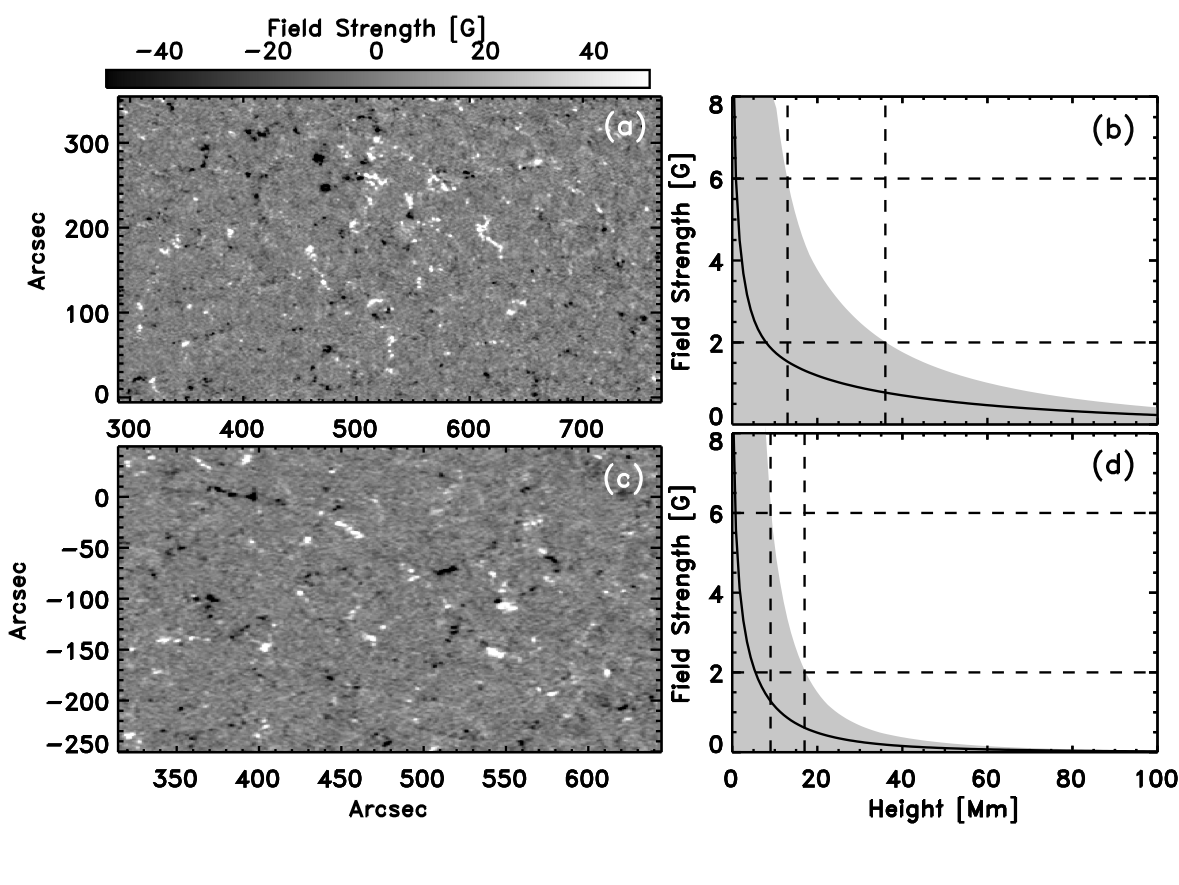
Figure 5: Quiet-Sun magnetograms from 12-June-2010 (panel (a); field-of-view of 480x360 arcsec) and 16-February-2011 (panel (c); field-of-view of 330x300 arcsec) used as a boundary condition for the local domain model. The corresponding average field strength as a function of height in the corona is shown in panel (b) for the event of 12-June-2010 and panel (d) for the event of 16-February-2011. The grey area shows the spread of the magnetic-field strength. The vertical dashed lines indicate the height at which a maximum field strength of 6 G and 2 G is achieved (horizontal lines).
Both approaches return different estimates of the height range through which the pulse propagates. The range estimated using the local domain (9-36 Mm) is much lower than the temperature scale height corresponding to the passbands used to observe the pulse as well as the densities measured using Hinode/EIS and is inconsistent with previous estimates (Kienreich et al, 2009; Patsourakos et al., 2009). However, the height range estimated using the PFSS approach (70-130 Mm) is consistent with that predicted by the plasma parameters and previous measurements. This indicates that the magnetic field in the region of the corona through which the pulse propagates is not dominated by the small-scale magnetic field anchored in the photosphere below. The increasing number of observations made using a wide variety of instruments suggests that "EIT waves" are a global phenomenon influenced by global-scale features.
References
---------------
Kienreich, I.W., Temmer, M., Veronig, A.M., 2009, ApJL, 703(2), L118
Lin, H., Kuhn, J.R., Coulter, R., 2004, ApJ, 613(2), 177
Long, D.M., Gallagher, P.T., McAteer, R.T.J., Bloomfield, D.S., 2011a, A&A, 531, 42
Long, D.M., Deluca, E.E., Gallagher, P.T., 2011b, ApJL, 741(1), L21
Long, D.M., Williams, D.R., Régnier, S., Harra, L.K., 2013a, Solar Physics, accepted
Patsourakos, S., Vourlidas, A., Wang, Y.M., Stenborg, G., Thernisien,A., 2009, Solar Physics, 259(1), 49
Raouafi, N.E. Sahal-Brechot, S., Lemaire, P., 2002, A&A, 396, 1019
Régnier, S., Priest, E.R., Hood, A.W., 2008, A&A, 491(1), 297
Roberts, B., Edwin, P.M., Benz, A.O., 1984, ApJ, 279, 857
Thompson, B.J., Plunkett, S.P., Gurman, J.B., Newmark, J.S., St Cyr, O.C., Michels, D.J., 1998, GRL, 25(1), 2465
Uchida, Y., 1970, PASJ, 22, 341
West, M.J., Zhukov, A.N., Dolla, L., Rodriguez, L., 2011, ApJ, 730(2), 122
Next EIS Nugget »» coming in June, 2013
TBC
Last Revised: 25-Sep-2012
Feedback and comments: webmaster
|


