Estimating the energy of a global 'EIT wave'
David Long, Deb Baker, David Williams, Eoin Carley, Peter Gallagher & Pietro Zucca

Coronal mass ejections (CMEs) are the most energetic eruptions in the solar system and can produce shock waves at both their front and flanks as they erupt from the Sun into the heliosphere. Although the energy produced by solar flares and CMEs has been investigated in detail (cf. Emslie et al., 2004, 2012), the amount of energy required to produce these shock waves is not very well characterised.
'EIT waves' are large-scale global perturbations produced during a solar eruption that travel at velocities of up to 1000 km/s and can traverse the Sun in less than an hour. Although first discovered using SOHO/EIT (e.g., Dere et al., 1997; Moses et al., 1997; Thompson et al., 1998), they have since been observed using TRACE (Wills-Davey & Thompson, 1999), STEREO/EUVI (e.g., Long et al., 2008; Veronig et al., 1998) and more recently SDO/AIA (e.g., Liu et al., 2010; Long et al., 2011). Although originally interpreted as either CME or flare-driven magnetohydrodynamic (MHD) waves or alternatively the signature of magnetic reconnection as a CME erupts into the heliosphere, there is a growing consensus that they are MHD waves initially driven by the rapid expansion of the CME in the low corona before propagating freely (cf., Patsourakos et al., 2010).
In Long et al., (2015) we estimate the energy of an 'EIT wave' observed on 25-February-2014 using the Sedov-Taylor relationship for a blast wave emanating from a point source (Sedov, 1946; Taylor, 1950). We show that this provides an excellent approximation for a shock front propagating through a region of variable density and, as a result, we estimate that the 'EIT wave' has an energy of ~2.8 x 1031 ergs, approximately 10% that of the associated CME (~2.5 x 1032 ergs).
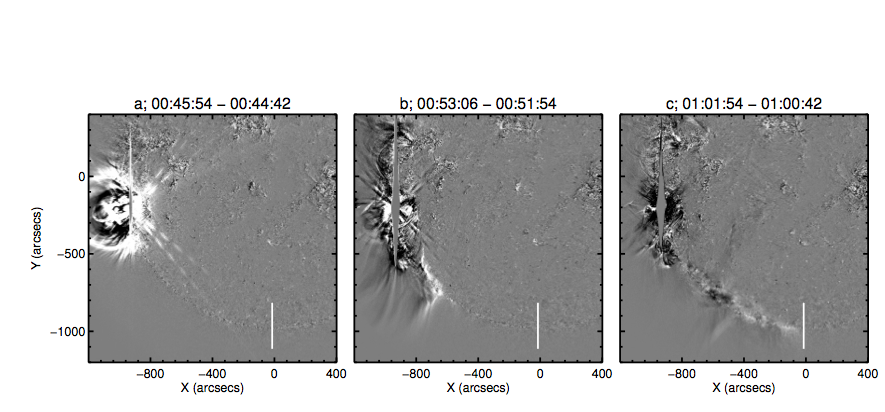
Figure 1: Running-difference images from the 193Å passband onboard SDO/AIA showing the propagation of the global wave-pulse at 00:45:54 UT (panel a), 00:53:06 UT (panel b) and 01:01:54 UT (panel c). The EIS slit, located at the southern polar coronal hole, is indicated in each panel.
Characterising the Pulse
Before attempting to use the pulse to study the corona or estimate its energy, it was important to characterise and understand the nature of the pulse itself. The pulse erupted from an active region at the solar limb, but was unable to propagate on-disk due to the presence of nearby active regions (as shown in Figure 1). Instead, the pulse propagated along the solar limb towards the southern polar hole. A deprojected annulus was therefore used to identify and track the pulse and measure its kinematics as shown in Figure 2. This was done over a range of heliocentric distances of 1-1.3 solar radii, returning a mean pulse velocity of 920 ± 119 km/s and a mean acceleration of -169 ± 156 m/s2. These values are much larger than the range estimated using SOHO/EIT (200-400 km/s; Thompson & Myers, 2009) and the mean velocity estimated using SDO/AIA (~644 km/s; Nitta et al., 2013). This indicates that the pulse measured here was a particularly fast feature, and suggests that it may have been shocked.

Figure 2: Top: Base-difference deprojected annulus image showing the eruption at 00:50:18 UT in the 193Å passband. The vertical axis shows the height from Sun-centre in solar radii while the horizontal axis shows the angle clockwise from solar north. Bottom: Base-difference image showing the temporal variation at a height of 1.1 Rsun (indicated by the dashed white line in the upper panel). The dashed white line shows the fit to the shock front at the leading edge of the bright feature, with the fitted initial velocity and acceleration given in the bottom right of the panel.
This is supported by observations of a Type II burst from 00:46-01:06 UT which indicates the presence of a shock. The Type II burst was observed by both the Learmonth Solar Radio Spectrograph and the Siberian Solar Radio Telescope and exhibited a slow drift from ~400 to ~100 MHz. It was possible to estimate the height at which the shock was formed by assuming that we are observing plasma emission and can therefore convert frequency directly to electron density. The radial stratification of density with height was estimated using the approach of Zucca et al. (2014), allowing the height of the shock to be estimated at ~1.1 Rsun.
Finally, the variation in intensity of the pulse in EUV images can be used to estimate its Mach number assuming no strong variation in temperature and a constant density along the depth of emission (taken as the pressure scale height, cf., Muhr et al., 2011; Zhukov, 2011). The intensity was measured close to the source of the eruption and over the coronal hole at the south pole. In both cases, a clear increase in intensity could be seen, allowing Mach numbers of 1.10 and 1.07 to be measured close to the source and over the polar hole respectively (see Figure 3). It was also possible to compare the variation in AIA intensity with that of EIS, since EIS was observing the south polar hole at the time of this eruption. EIS measurement of Fe XII emission shows a jump comparable to that observed by AIA, leading to a similar estimate for the Mach number of the pulse (~1.08).

Figure 3: The eruption from 25-February-2014 as observed by the SDO/AIA 193Å passband. The eruption is shown close to the source using intensity and running-difference images in panels a & b respectively and over the South Pole using intensity and running-difference images in panels d & e respectively. Panels c & f show the intensity profiles from the white square regions shown in panels a & d. The Hinode/EIS field-of-view is shown in panels d & e, with the intensity profile from the EIS pixels within the white box shown in blue in panel f. The intensity images in panels a & d were processed for display here using the Multi-scale Gaussian Normalisation (MGN) technique of Morgan & Druckmuller (2014).
Energetics of the eruption
With the wave pulse identified as a propagating shock wave, the Sedov-Taylor relation was used to try and estimate its energy. This was originally developed during the Second World War to estimate the energy of a nuclear bomb blast and assumes a spherical blast wave emanating from a point source. Assuming that the shock front is passing through a constant density region, it is possible to plot the variation in bubble radius R with time t as Log R ≈ (2/5)Log t + (E/n)(1/5) where E is the energy and n is the density. Alternatively, the passage of the shock front through a region of variable density where n ∝ r-α can be plotted using Log R ≈ 2/(5-α)Log t + (E/n)1/(5-α). The variation in pulse radius with time was plotted for a height of 1.1 Rsun as shown in Figure 4.
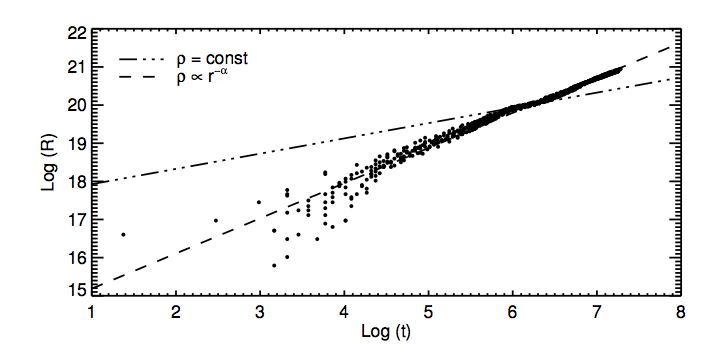
Figure 4: Plot of log R versus log t for the distance of the shock front from the source at a height of 1.1 Rsun. The constant density fit is shown by the dot-dash line with the dashed line indicating the fit assuming a variable-density medium (ρ ∝ r-α with α = 2.78).
It is clear from Figure 4 that the constant-density model does not provide a good fit to the data. However, the variable density model provides an excellent fit to the data for α = 2.78. This is consistent with the concept of the shock propagating from a high-density active region through the lower-density quiet Sun towards the much lower-density coronal hole at the south pole. It is then possible to estimate the energy required to produce the shock wave using a typical estimate for the coronal density (in this case ~10 x 8 cm-3). This produces an energy estimate of E ≈ 2.78 x 1031 ergs for the shock wave. The total mechanical energy of the CME was also calculated using the kinematics and mass measurements of the CME from LASCO C2 and C3 for comparison, and was estimated at ≈ 2.6 x 1032 ergs. This indicates that approximately 10% of the energy of the CME was required to produce the associated 'EIT wave', in agreement with the suggestion of Vourlidas et al. (2010).
Discussion
Although the Sedov-Taylor relation is strictly valid for a spherical blast wave emanating from a source point, it works extremely well in this case assuming a variable density medium. A growing consensus suggests that 'EIT waves' are produced by the very rapid expansion of an erupting CME in the low corona. The excellent agreement between the Sedov-Taylor relation and the observations here suggests that the period over which the 'EIT wave' is initially driven is sufficiently short to allow it to be interpreted as a blast wave. This suggests that it is possible to estimate the energy of 'EIT waves' using this approach and that the 'EIT wave' energy is comparable to that of a flare and must be accounted for when examining the energy budget of solar eruptions.
References
Emslie, A.G., Kucharek, H., Dennis, B.R. et al., 2004, JGR, 109, 10104
Emslie, A.G., Dennis, B.R., Shih, A.Y. et al., 2012, ApJ, 759, 71
Dere, K.P., Brueckner, G.E., Howard, R.A., et al., 1997, Sol. Phys, 175, 601
Liu, W., Nitta, N.V., Schrijver, C.J. et al., 2010, ApJ, 723, L53
Long, D.M., Baker, D., Williams, D.R., et al., 2015, ApJ
Long, D.M., Deluca, E.E., Gallagher, P.T., 2011, ApJL, 741(1), L21
Long, D.M., Gallagher, P.T., McAteer, R.T.J., & Bloomfield, D.S., 2008, ApJ, 680, L81
Moses, D., Clette, F., Delaboudinière, J.P., et al., 1997, Sol. Phys., 175, 571
Morgan, H. & Druckmüller, M., 2014, Sol. Phys., 289, 2945
Muhr, N., Veronig, A.S., Kienreich, I.W. et al., 2011, ApJ, 739, 89
Nitta, N.V., Schrijver, C.J., Title, A.M. & Liu, W., 2013, ApJ, 776, 58
Patsourakos, S., Vourlidas, A. & Stenborg, G., 2010, ApJ, 724, L188
Sedov, L.I., 1946, Journal of Applied Mathematics and Mechanics, 10, 241
Taylor, G., 1950, Royal Society of London Proceedings Series A, 201, 159
Thompson, B.J., Plunkett, S.P., Gurman, J.B., et al., 1998, GRL, 25(1), 2465
Thompson, B.J. & Myers, D.C., 2009, ApJS, 183, 225
Veronig, A.,M., Temmer, M., Vrsnak, B., 2008, ApJ, 681, L113
Vourlidas, A., Howard, R.A., Esfandiari, E. et al., 2010, ApJ, 722, 1522
Wills-Davey, M.J. & Thompson, B., 1999, Sol. Phys., 190 (1), 467
Zucca, P., Carley, E.P., Bloomfield, D.S. & Gallagher, P.T., 2014, A&A, 564, A47
Next EIS Nugget »» coming later...
TBC
Last Revised: 16-Dec-2015
Feedback and comments: webmaster
|


