Upflows induced by magnetic reconnection above an erupting flux rope
Teia Mihailescu - UCL/MSSL
Plasma upflows are characteristic of all active regions, and their presence at the edges of active regions was one of the major discoveries of Hinode EIS. Among the main characteristics of these upflows are their longevity, spatial stability and occurence in pairs. One driving mechanism that accounts for all of these properties was first proposed by Baker et al. (2009) - magnetic reconnection along quasi separatrix layers (QSLs). In this study, we explore the driving mechanisms of the very strong upflows with velocities in excess of 70 km/s, known as blue-wing asymmetries, observed at the edges of AR 10977 during the eruption of a flux rope. We ask the question - how are the strong upflows related to the magnetic topology of the active region and its surroundings?
AR 10977 appeared on the East limb on 1 December 2007. It spent approximately three days in its emergence phase following which flux cancellation dominated during its decay phase. The flux cancellation was concurrent with the coronal arcade field becoming progressively more sheared and eventually forming a continuous forward S sigmoid in EUV emission. This suggests the formation of a flux rope in the active region (van Ballegooijen and Martens, 1989) - the full account of the photospheric magnetic field and coronal evolution of the active region is given by Green et al. (2011). The sigmoid/flux rope continued to evolve until it finally erupted on the 7 December. The eruption took place in two stages: a failed eruption began just after 00:00 UT and was followed by a CME that began just after 04:00 UT and was associated with a B1.4-class GOES flare and a global wave (Green et al., 2011). Following the CME, the sigmoid structure transformed to an arcade field.
The evolution of the Doppler velocities, nonthermal velocities and blue-wing asymmetries (α) appear to be related to the timeline of the failed eruption and the CME: they intensify during these events and then return to initial levels (see Figure 1). The eastern/western upflow regions are located over the following/leading magnetic polarities of either sides of the active region throughout its evolution. The extent of the upflows remains relatively large on both sides throughout the period of the failed eruption and CME before significantly shrinking 6.5 hours after the CME. In parallel, the nonthermal velocities evolve from small patches mainly corresponding to the stronger magnetic field regions on either side of the active region to being much stronger and more extended after the peak times of each event. Late in the decay phase, they weaken and shrink again. The blue-wing asymmetry maps show that, before the sigmoid/flux rope activation, small patches of enhanced α are present in the northern part of the positive polarity and more extended ones above the dispersed negative field. The area covered and strength of the blue-wing asymmetries is greatest at the onset (00:18 UT) and immediately after the peak (01:15 UT) of the failed eruption. The spatial extent shrinks back by 11:26 UT (6.5 hours after the CME).
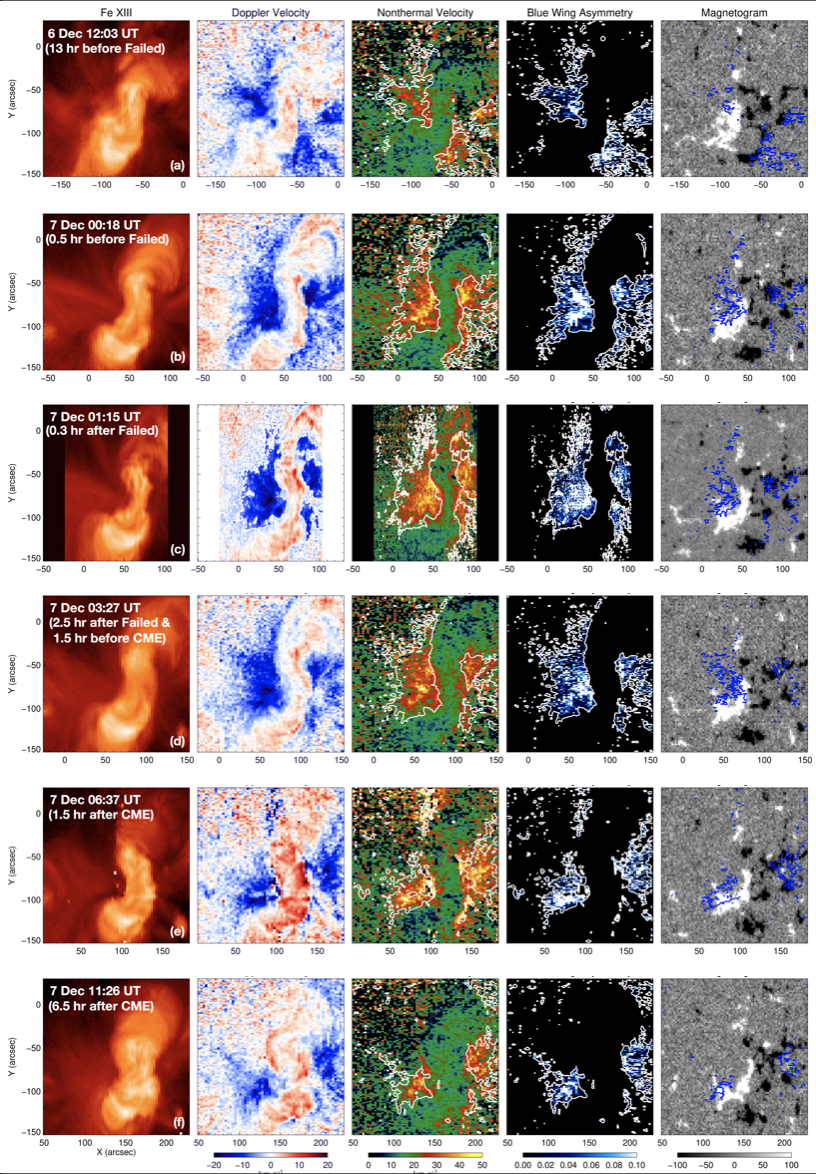
Figure 1: Left to right: Hinode/EIS single Gaussian Fe XIII 202.04 intensity, Doppler velocity and
nonthermal velocity, blue-wing asymmetry (α) maps and MDI magnetogram. Asymmetry maps
are overplotted with Doppler velocity contour of -5 km/s and magnetograms are overplotted with
α contour of 0.1. Asymmetry maps are saturated at 0.1.
To explore the large scale coronal magnetic field configuration in and around AR 10977, we used a potential field source surface (PFSS) model. The extrapolation shows that the magnetic topology is a quadrupolar configuration with a null point located above the flux rope region (Figure 2a). In this configuration, as the flux rope expands and rises during the building phase (flux cancellation), the short yellow arcade field loops are also forced to rise and push against the overlying, more extended yellow loops (Figure 2b). This drives reconnection at the null point, creating new (green) magnetic field lines (Figure 2c). The null point is part of a more extended arc shaped structure, called a separator, along which reconnection takes place. Figure 2a shows a 2D slice through the separator which includes the null point, while Figure 3 shows its 3-dimensional extent. The field lines created via reconnection along the separator are spatially correlated with the strongest blue- wing asymmetries in the upflow regions on both sides of the active region (Figure 3).
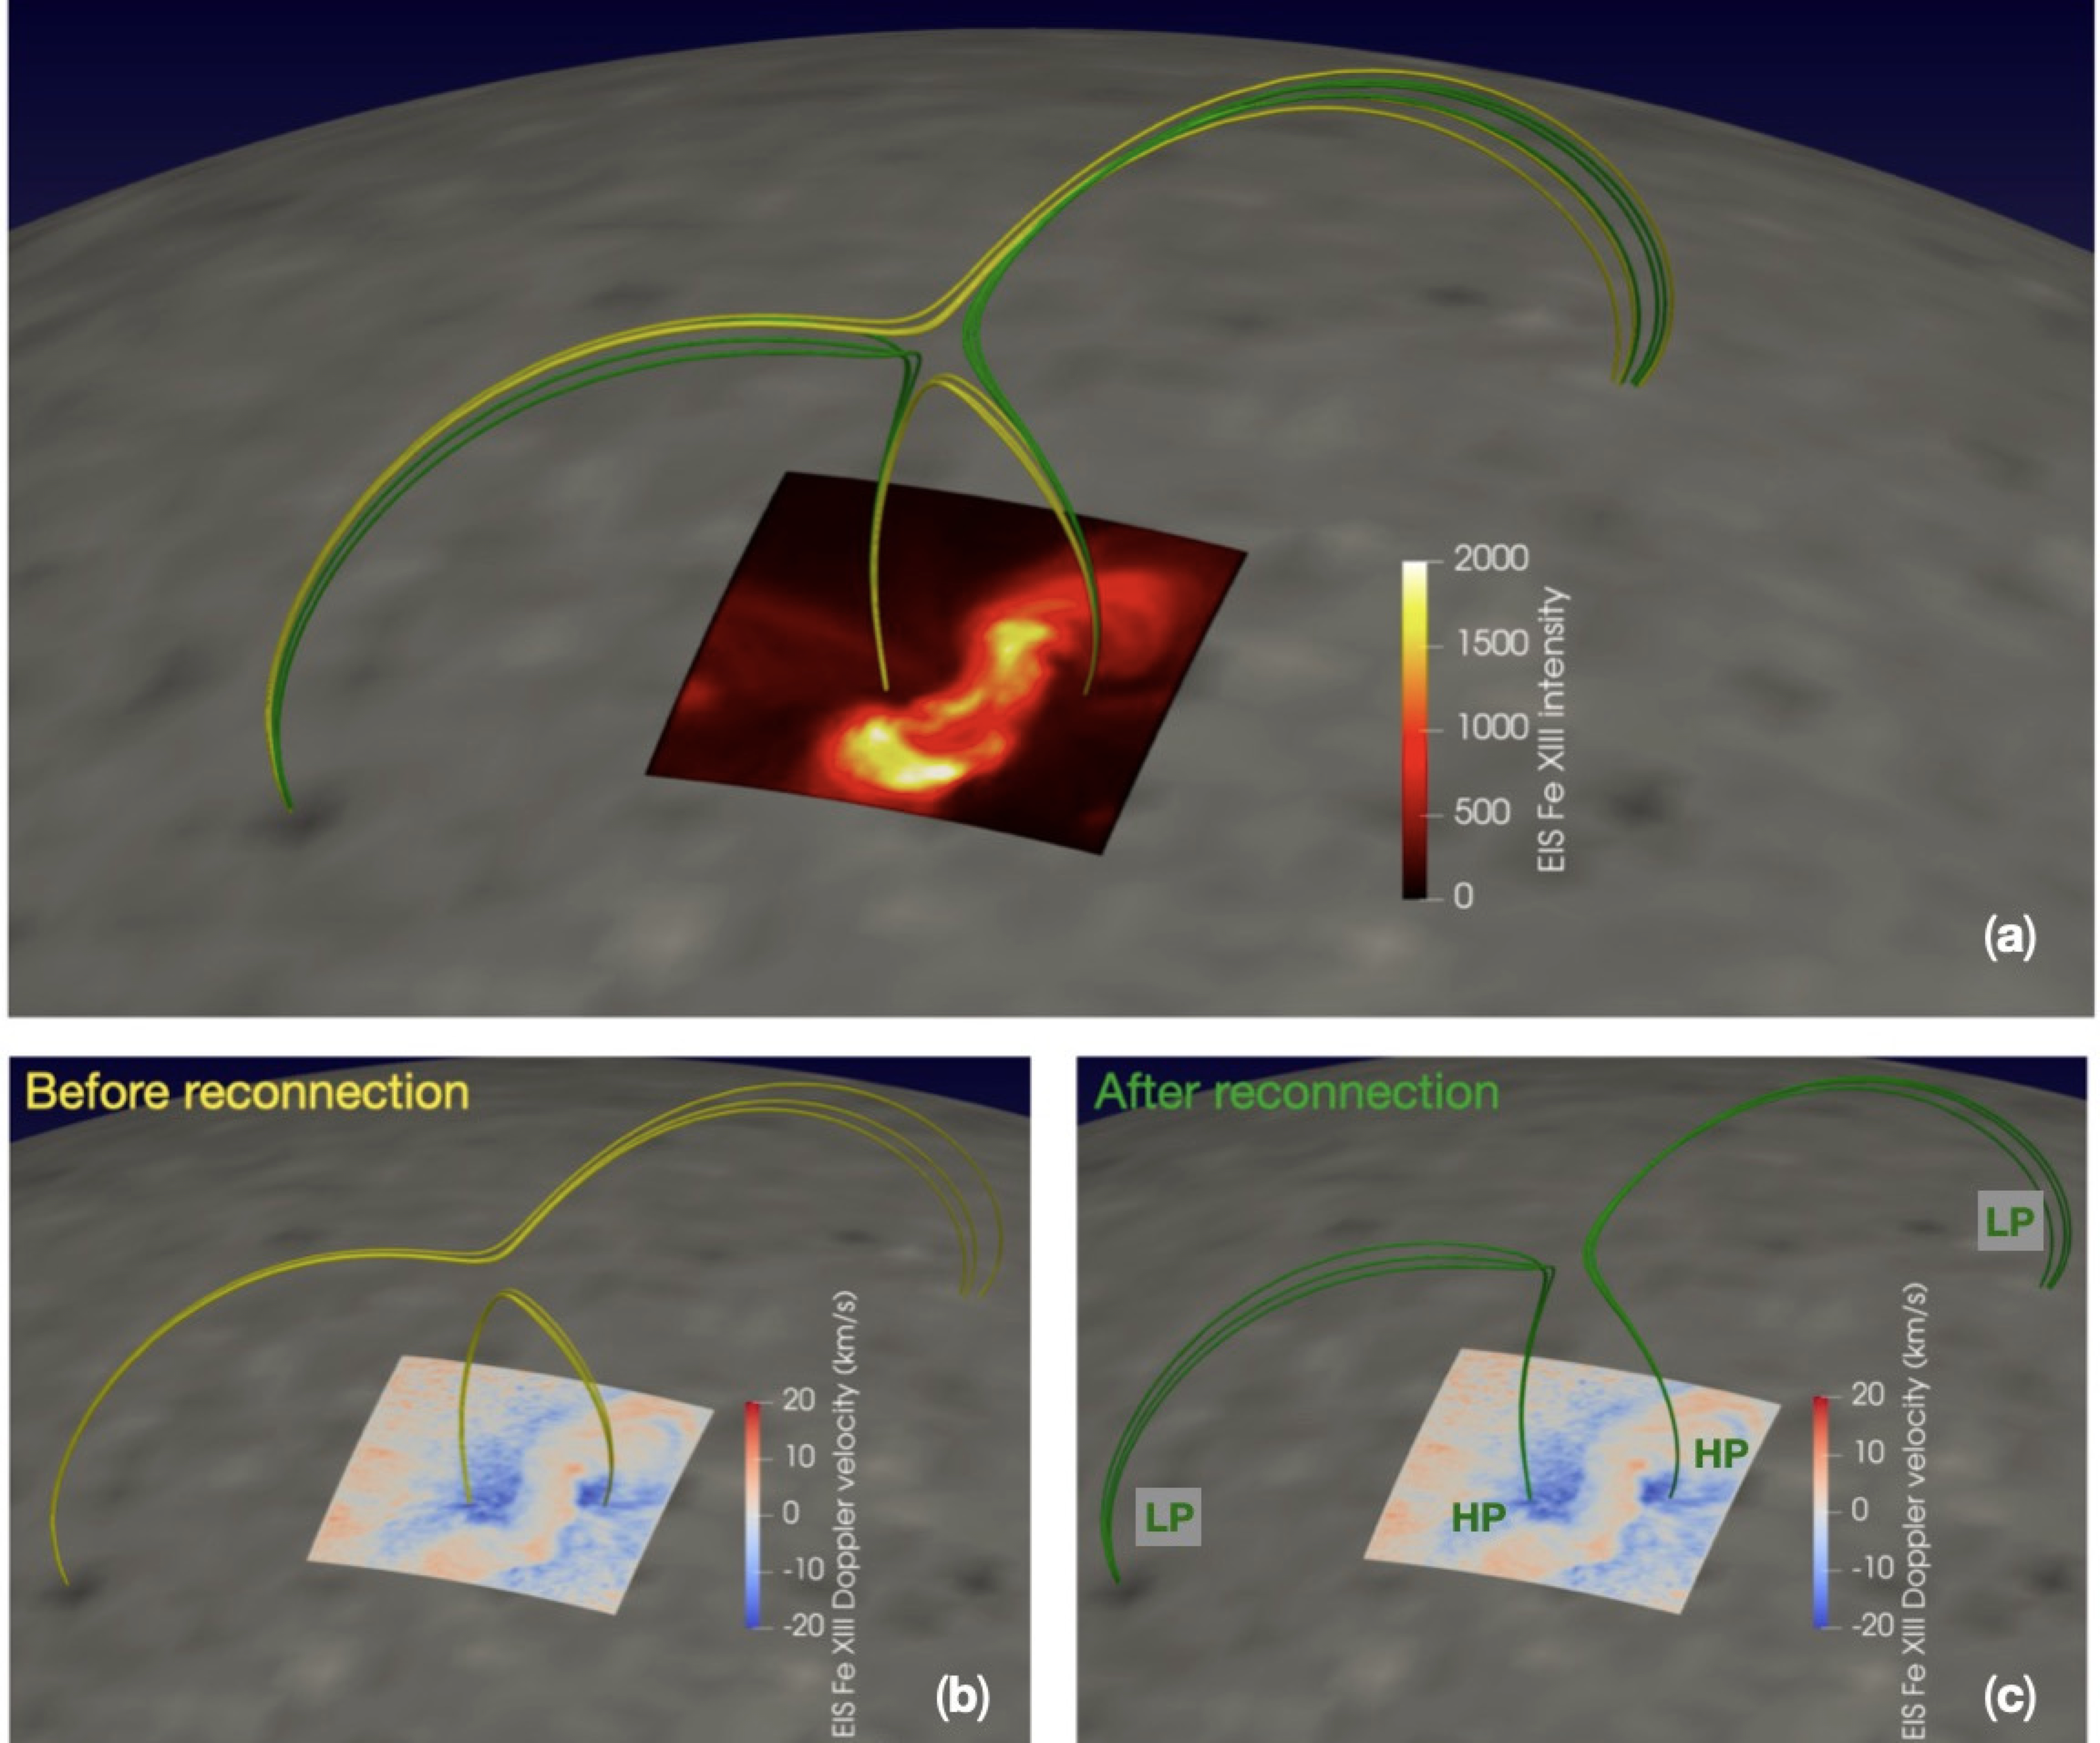
Figure 2: PFSS extrapolation at 00:04 UT on 7 December 2007 showing a quadrupolar configuration with a magnetic null point located above the sigmoid, where the four sets of field lines are closest together (a). Field lines are plotted on the Hinode/EIS Fe xiii 202.04 intensity map at 00:18 UT and the background magnetogram (the intensity map is plotted as observed with no vertical extension). The selected field lines plotted on the corresponding Doppler velocity map are color-coded to indicate the magnetic configuration before (b, yellow) and after (c, green) magnetic reconnection. HP is high pressure and LP is low pressure as found in the loops just after reconnection.
The two sets of yellow pre-reconnection loops (Figure 2b) contain plasma with drastically different thermal pressures. The yellow arcade loops located above the flux rope are dense and hot, while the longer and more extended yellow loops are cooler and more tenuous. When reconnection takes place at the null point, the newly formed green loops (Figure 2c) have strong pressure in the section that is closest to the active region than the section that is rooted in the weak field further away. Consequently, the post-reconnection pressure gradient drives strong upflows along the reconnected flux tubes.
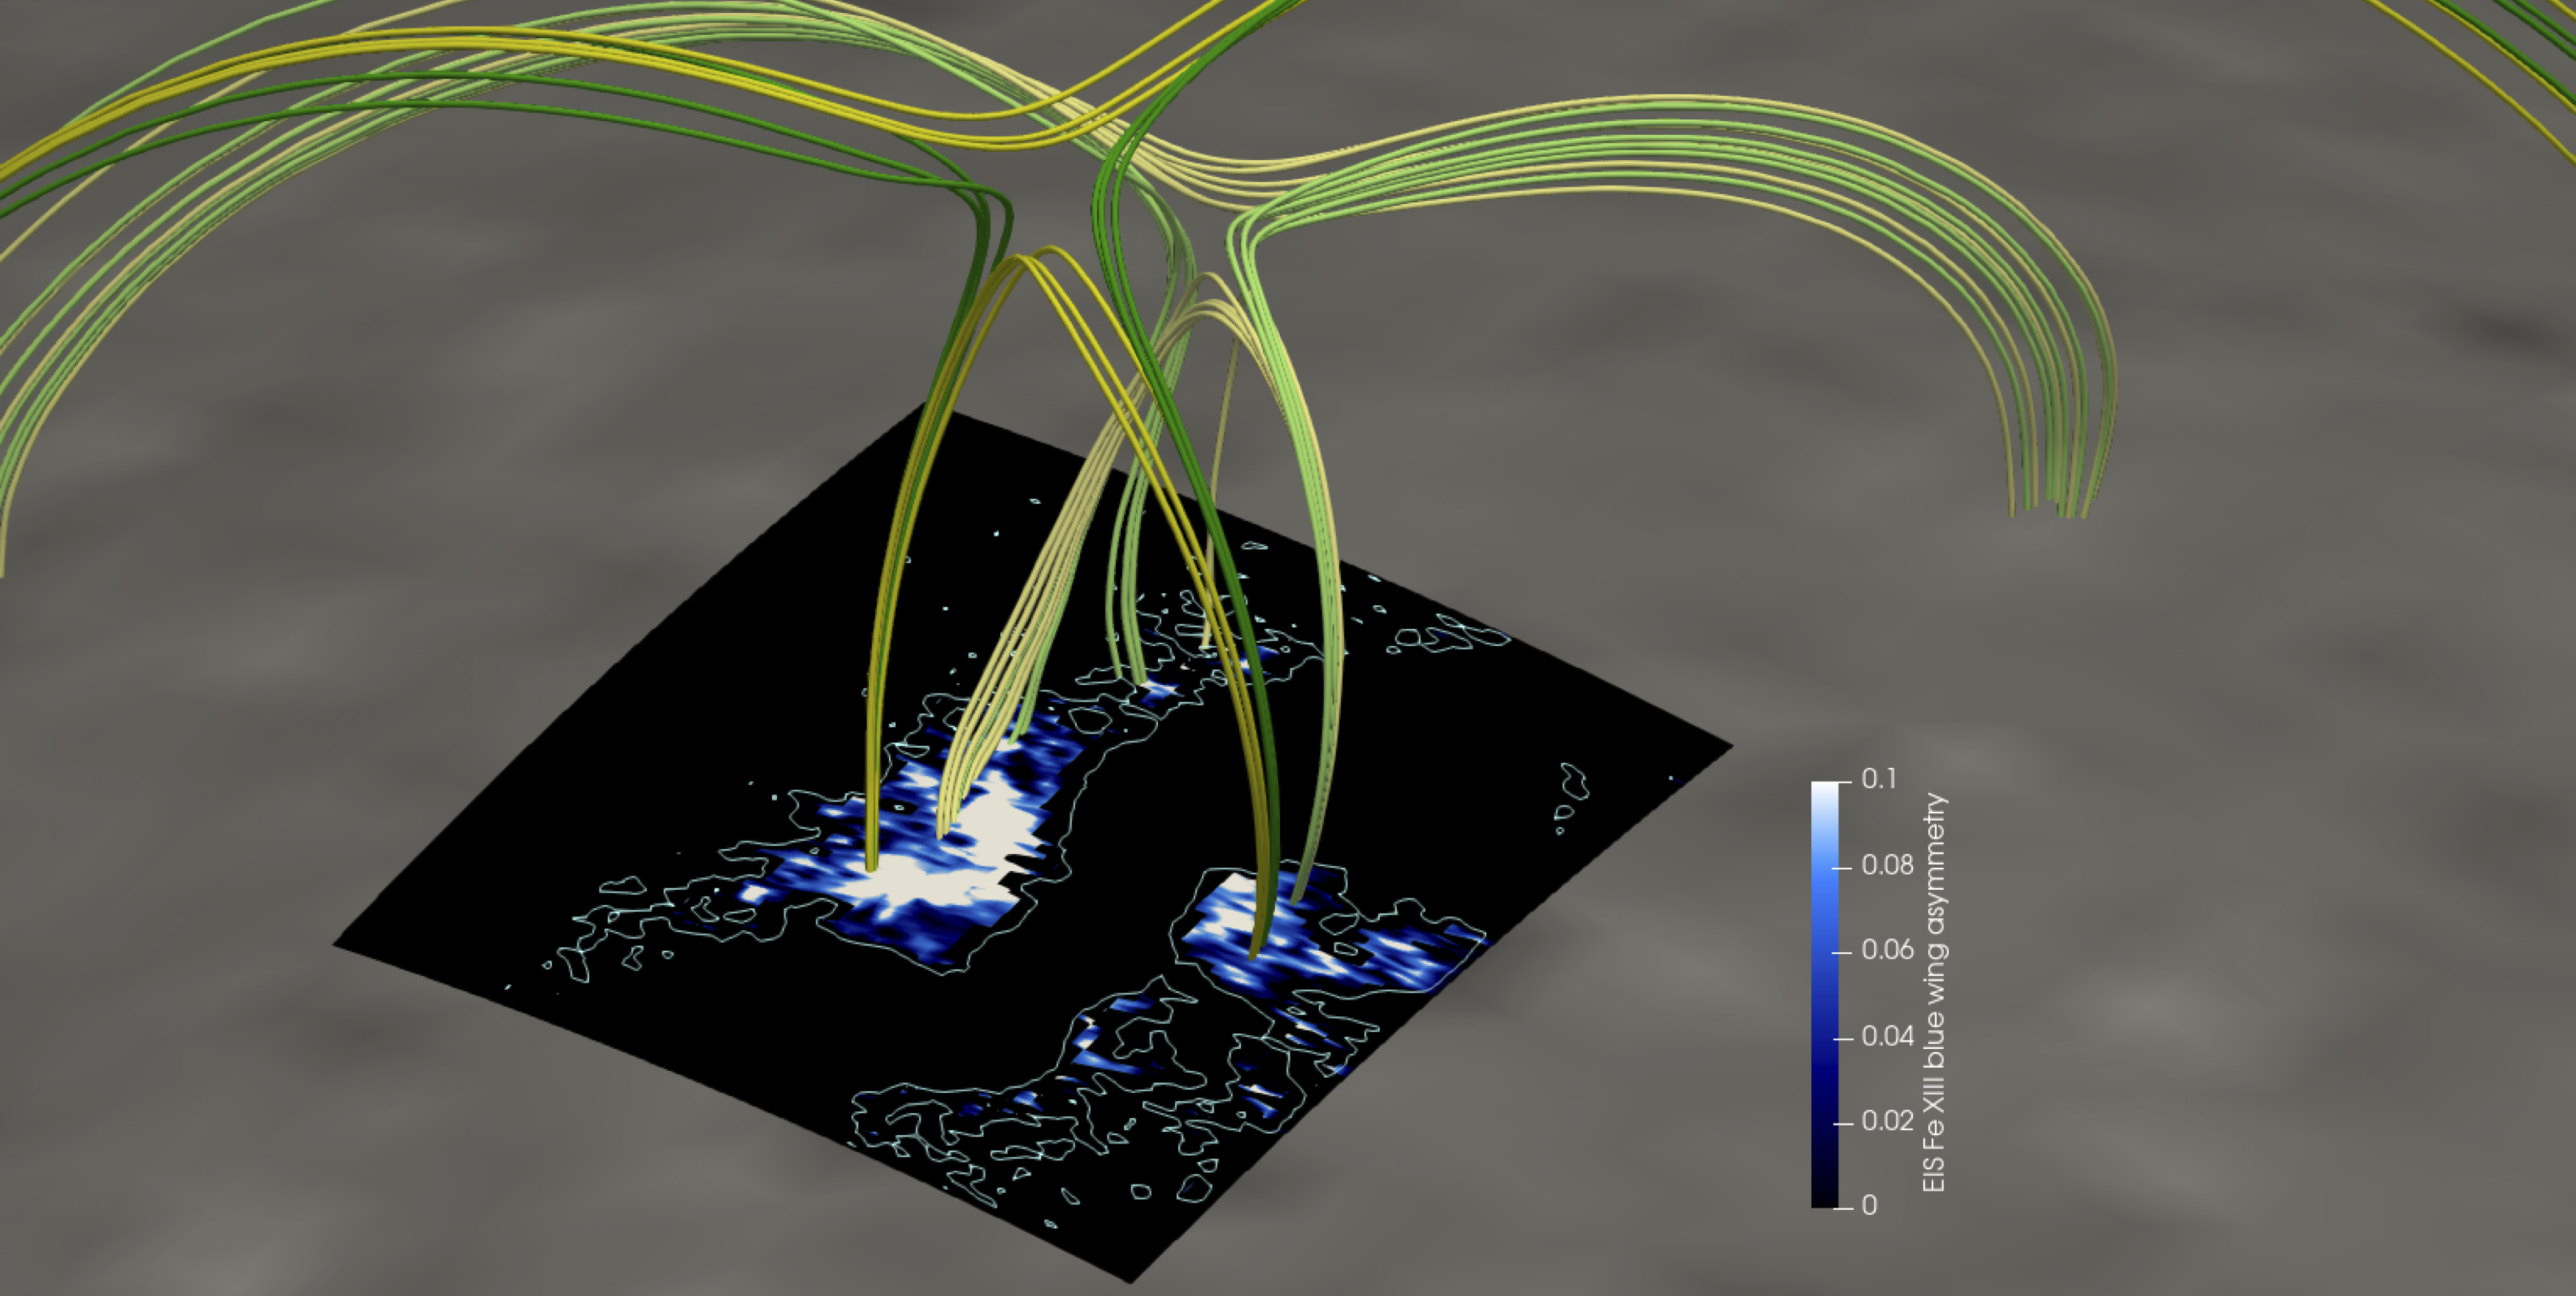
Figure 3: PFSS extrapolation at 00:04 UT on 7 December 2007 showing the three dimensional nature of the separator structure. Field lines are plotted on a blue-wing asymmetry map at 00:18 UT.
Magnetic configurations with complex topologies that include separatrices, e.g. null points and separators, have been generalised in 3D to quasi-separatrix layers (QLS; Demoulin et al., 1996). Therefore, AR 10977 provides a clear case of QSL reconnection creating and driving active region upflows as first proposed by Baker et al. (2009) and followed by van Driel-Gesztelyi et al. (2012).
For more details, see Baker et al., Solar Physics 296:103, 2021:
Plasma Upflows Induced by Magnetic Reconnection Above an Eruptive Flux Rope
References
Baker, D., van Driel-Gesztelyi, L., Mandrini, C. H., Demoulin, P., and Murray, M. J. (2009). Magnetic reconnection along quasi-separatrix layers as a driver of ubiquitous active region outflows. Astrophysical Journal, 705(1):926-935.
Demoulin, P., Henoux, J. C., Priest, E. R., and Mandrini, C. H. (1996). Quasi-Separatrix layers in solar flares. I. Method. Astronomy and Astrophysics, 308:643-655.
Green, L. M., Kliem, B., and Wallace, A. J. (2011). Photospheric flux cancellation and associated flux rope formation and eruption. Astronomy and Astrophysics, 526:A2.
van Ballegooijen, A. A. and Martens, P. C. H. (1989). Formation and Eruption of Solar Prominences. Astrophysical Journal, 343:971.
van Driel-Gesztelyi, L., Culhane, J. L., Baker, D., Demoulin, P., Mandrini, C. H., DeRosa, M. L., Rouillard, A. P., Opitz, A., Stenborg, G., Vourlidas, A., and Brooks, D. H. (2012). Magnetic Topology of Active Regions and Coronal Holes: Implications for Coronal Outflows and the Solar Wind. Solar Physics, 281(1):237-262.
Next EIS Nugget »» coming soon...
TBC
Last Revised: 27-Oct-2011
Feedback and comments: webmaster
|


