Some active regions display a forward or reverse S structure when observed in soft X-ray or
EUV emission. These regions are monitored for eruptive activity as they have a high likelihood of
producing a coronal mass ejection. This nugget looks at what we can learn about the formation of a
sigmoidal active region using EIS data.

Figure 1:
Hinode/XRT image showing the continuous S shaped sigmoidal structure of active region NOAA 10977 on 7 Dec. 2007 at 03:29 UT. A linear feature running roughly north-south over the centre of the sigmoid is also observed.
NOAA active region 10977 evolved to exhibit a sigmoidal structure during its disk transit in December
2007. The soft X-ray emitting loops in the region become increasingly sheared
as the region rotated over the East limb, and
a diffuse but continuous sigmoid was seen to have developed in the region
by 15:51 UT on 6 Dec.
Figure 1 shows the sigmoid in the active region
as seen at 03:29 UT on 7 Dec by Hinode/XRT. A linear feature is also seen in the region crossing
the sigmoid centre and alinged north-south. It produced an eruption on 7 December at around
04:20 UT in association with an EUV wave and a B-class GOES flare.
MDI observations of the evolution of the line of sight magnetic field show that
the active region is in its decay phase in the time leading up to the eruption.
Flux cancellation is observed, resulting from the approach and reconnection of
magnetic fragments at the polarity inversion line.
The sigmoid makes an inverse crossing of the
polarity inversion line at the sigmoid centre where flux is cancelling.
This suggests the presence of concave-up, or bald patch, field lines in this location.
The evolution of the active region strongly suggests that a flux
rope is being built in the region prior to the eruption by the mechanism
proposed by
van Ballegooijen and Martens (1989).
Figure 2 shows the
location of the inverse crossing of the sigmoid centre as indicated by the dashed lines.
The linear feature crosses the polarity inversion line in the normal direction,
indicating that this feature represents a bundle of arcade field lines.
Flux cancellation is observed at the southern section of the linear feature.
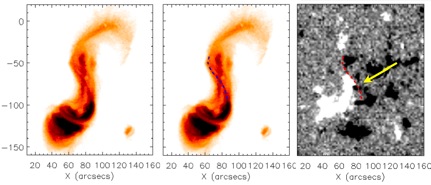
Figure 2:
Hinode/XRT images (left and middle panel) of the continuous sigmoid seen at 7 Dec. 2007 at 03:29 UT. When the soft X-ray emission is overlaid onto SOHO/MDI data (right panel) it is seen that the centre of the sigmoid crosses the polarity inversion line in the inverse direction.
(Click figure to see full-size image)
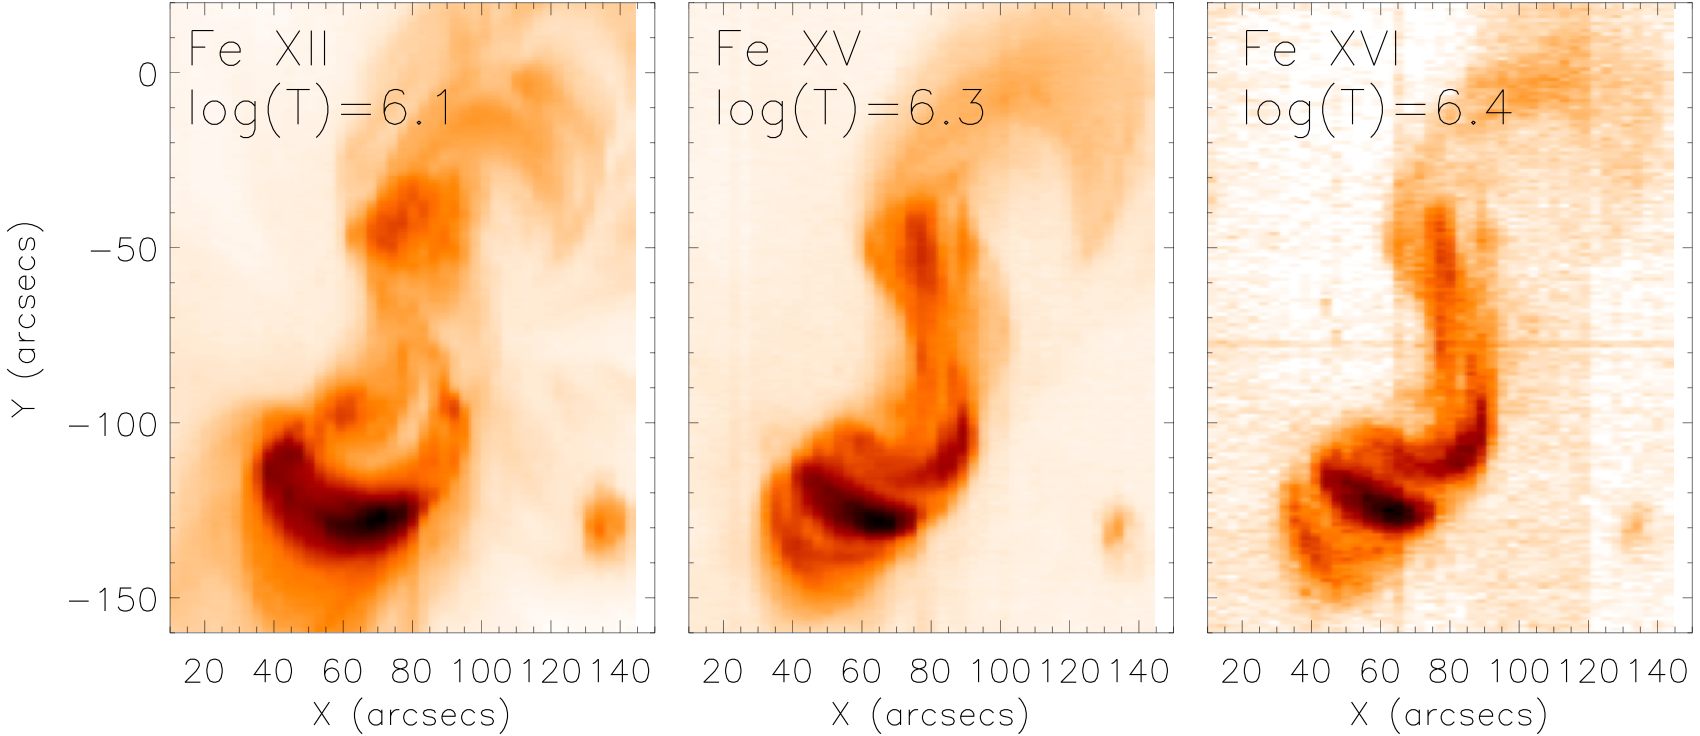
The temperature structure of the region has been investigated using EIS data.
Figure 3
shows the data obtained by an EIS scan taken with the 1" slit taken between 7 Dec. 03:27 and 04:19 UT,
immediately before the onset of the eruption. The sigmoid is seen at temperatures log(T[K]) = 6.1 to 6.4
but the linear feature is only seen in hotter lines which image plasma at log(T[K]) = 6.3 to 6.4.
Line widths can also be studied to investigate where the energy release sites are in the active region.
Figure 4 shows the non-thermal velocities, obtained from the line widths,
of the Fe XV line. The broadenings trace out both the diagonal part of the sigmoid centre and the linear feature.
The whole of the linear feature is seen in the top two rows, but only the southern part of the linear
feature is seen in the bottom row. These non-thermal velocities suggest energy deposition in
the location of the sigmoid centre and the linear feature, especially the southern section of the
linear feature at later times. These non-thermal velocity enhancements could be the result
of reconnection which forms the flux rope (inferred from the active region evolution and sigmoid presence)
and subsequent
reconnection which joins part of the arcade flux of the linear feature to the flux rope body.
In this way, the EIS observations support the interpretation that the cancellation of the
line of sight photospheric magnet field is caused by reconnection, and that this reconnection
facilitates the flux rope formation.
From this study it can be seen that EIS data provide important information to better understand
the evolution of active region magnetic fields.
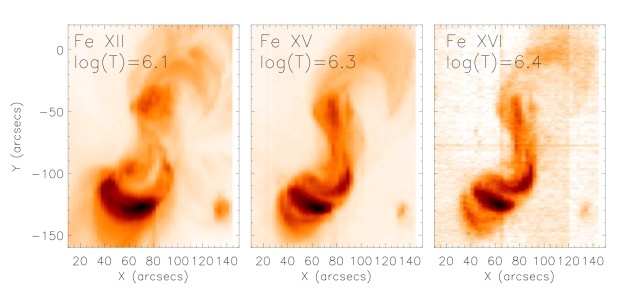
Figure 3:
Temperature structure of AR 10977 as seen by EIS in a scan of the region taken with the 1" slit between 7 Dec. 03:27 and 04:19 UT.
(Click figure to see full-size image)
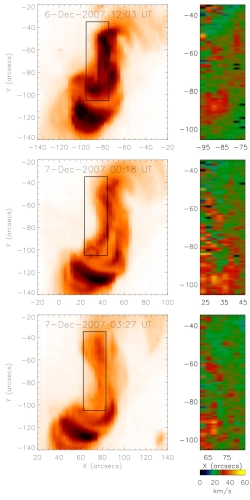
Figure 4:
EIS observations of AR 10977 in the Fe XV 284 Å line formed at a temperature of 2 MK. Start times of the EIS scans are given in the left-hand panels which show the Fe XV emission. The right-hand panels show the non-thermal component of the line width in the sub-area indicated by the black boxes in the left panels.
(Click figure to see full-size image)
Reference:
This nugget is taken from a paper accepted for publication in Astronomy and Astrophysics by L.M. Green, B. Kliem and A.J. Wallace.
The link: http://arxiv.org/abs/1011.1227