Introduction
Chromospheric evaporation is largely accepted to be the process
by which solar flares achieve their high temperatures and
densities. The standard flare model states that electrons are
accelerated at or near a magnetic reconnection site in the corona and
then travel along newly reconnected magnetic field lines toward the
chromosphere. Here, they are decelerated by the increasingly dense
atmosphere and typically lose their energy by one of two mechanisms:
an encounter with a proton or ion will result in the emission of a HXR photon through the
bremsstrahlung process; Coulomb collisions with ambient electrons, on
the other hand, result in an overall heating and, by consequence,
expansion of the chromospheric material. The velocity at which the
evaporated material rises is dependent on the total energy flux of
accelerated electrons (in erg cm
-2 s
-1) that
reach the footpoint and has traditionally been measured through
Doppler shifts of EUV and SXR emission lines. EIS provides the
capability to determine the location and magnitude of the evaporation
flows at high spatial, spectral, and temporal resolution for a myriad
of emission lines formed over a wide range of temperatures
simultaniously, marking a significant advancement over previous instruments. Coordinated
HXR observations from RHESSI can establish the location and the parameters
of the driving electron beam needed to test the predictions of
flare models.
Observations
By January 2008 Hinode had lost the use of its X-band transmitter. As
such, the amount of data being telemetered to the ground was severely
reduced. Also, in November 2007, the detectors on RHESSI had been
successfully annealed after five years of radiation damage, bringing
them back to specifications comparable to early 2005. Therefore,
December 2007 marks a unique time frame when both Hinode and RHESSI data
sets were near optimal. Fortunately this was also a fairly active
period of solar activity with several flares observed by both
instruments. The event presented here was a C1.1 flare that occurred
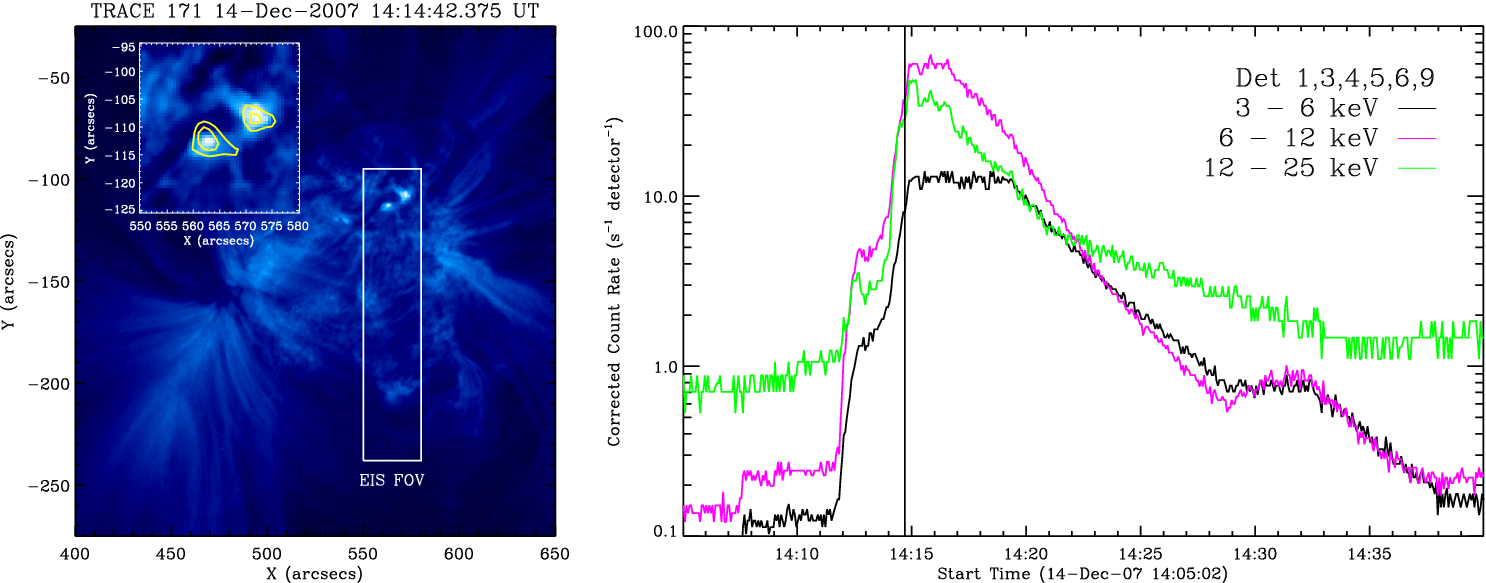
on 14 December 2007. The left hand panel of
Figure 1 shows the active region in which it
occurred as observed with TRACE. The box inset shows a zoomed in
portion where the flare occurred with the two loop footpoints clearly
visible. The corresponding HXR emission from RHESSI also aligns with
this footpoint emission. The right hand panel shows the RHESSI
lightcurves in 3 energy bands.

Figure 1: Left panel: NOAA 10978 as observed by TRACE during the
impulsive phase of the flare. The inset shows the footpoint emission
during the impulsive phase with the 20-25 keV emission observed with
RHESSI overlaid. Right panel: RHESSI lightcurves in the 3-6, 6-12,
and 12-25 keV energy bands. The vertical solid line marks the time of
the TRACE image. » Click figure to see full-size image.
Figure 2: Left panel: An Fe XVI raster taken during the flare's
impulsive phase. Right panel: The corresponding velocity map. The
contours overlaid denote the 20-25 keV emission as observed with RHESSI. » Click figure to see full-size image.
The observing study that EIS was running when the flare occurred
(CAM_ARTB_RHESSI_b_2) was originally designed to search for active
region and transition region brightenings in conjunction with
RHESSI. Using the 2'' slit, EIS rastered across a region of the Sun
from west to east covering an area of 40''x144'', denoted by the
rectangular box in
Figure 1. Each slit position had an exposure time
of 10 s resulting in an effective raster cadence of ~3.5
minutes. These fast-raster studies are preferred for studying temporal
variations of flare parameters while preserving the spatial
information. Equally important though is the large number of emission
lines that covered a broad temperature range. This observing study used 21
spectral windows, some of which contain several individual lines. The
work presented here focuses on 15 lines spanning the 0.05-16 MK temperature range.
The majority of these lines are well resolved and do not
contain blends, thereby reducing ambiguities in the interpretation of
their analysis. An example of one of the rasters taken during the
impulsive phase is shown in
Figure 2 (Fe XVI, 2.5 MK) along with its
associated Doppler velocity map. Again, the footpoints are visible near the
top of the raster and align well with the HXR footpoints as observed
by RHESSI. The velocity map shows that the bright footpoint emission
at this temperature is blueshifted (denoting upflowing plasma) as expected.
Not Expected
Many previous studies that investigated the chromospheric evaporation
process relied on detecting blueshifts in a single (or small number
of) emission line(s). In this event blueshifts were detected in 7
different ionization stages of iron (Fe XIII, Fe XIV, XV, XIV, XVII,
XXIII, and XXIV; i.e. >1.5 MK. See
Figure 3). A linear relationship
was also found between the magnitude of the velocity and the formation
temperature of the line, confirming theoretical predictions which
state that hotter material should rise faster due to the pressure
gradient relative to the overlying corona. However, it was also found
that emission lines formed below 1.5 MK were redshifted, which was not
expected. Early models (and indeed, observations) state that only
material at chromospheric and transition region temperatures (<0.5 MK;
i.e. below the site where the electrons are believed to deposit their energy)
should be redshifted due to the overpressure of the rising material.
These observations would therefore suggest that either the electrons become
thermalized at higher (coronal) altitudes, or the chromosphere is being
somehow ''backwarmed'' by the incident electron beam as it recoils. There is
also a possibilty that these ''cooler'' lines were formed out of ionization
equilibrium which could affect the assumed formation temperature.
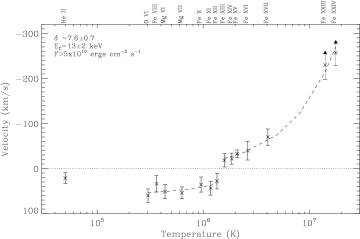
Figure 3: Evaporation velocity as a function of temperature for
each of the 15 lines used in this study. Negative velocities are
blueshifted (upflowing) while positive values are redshifted
(downflowing). The dashed lines are least-squares fits to the
blueshifted and redshifted (excluding the He II line) data
points. (Note that this is a log-normal plot so both least-sqaures
fits are linear.) The
values in the top left corner correspond to the parameters of the
electron beam as measured by RHESSI at the time of the flows (delta: spectral index,
Ec: low-energy cutoff, F: electron energy flux). » Click figure to see full-size image.
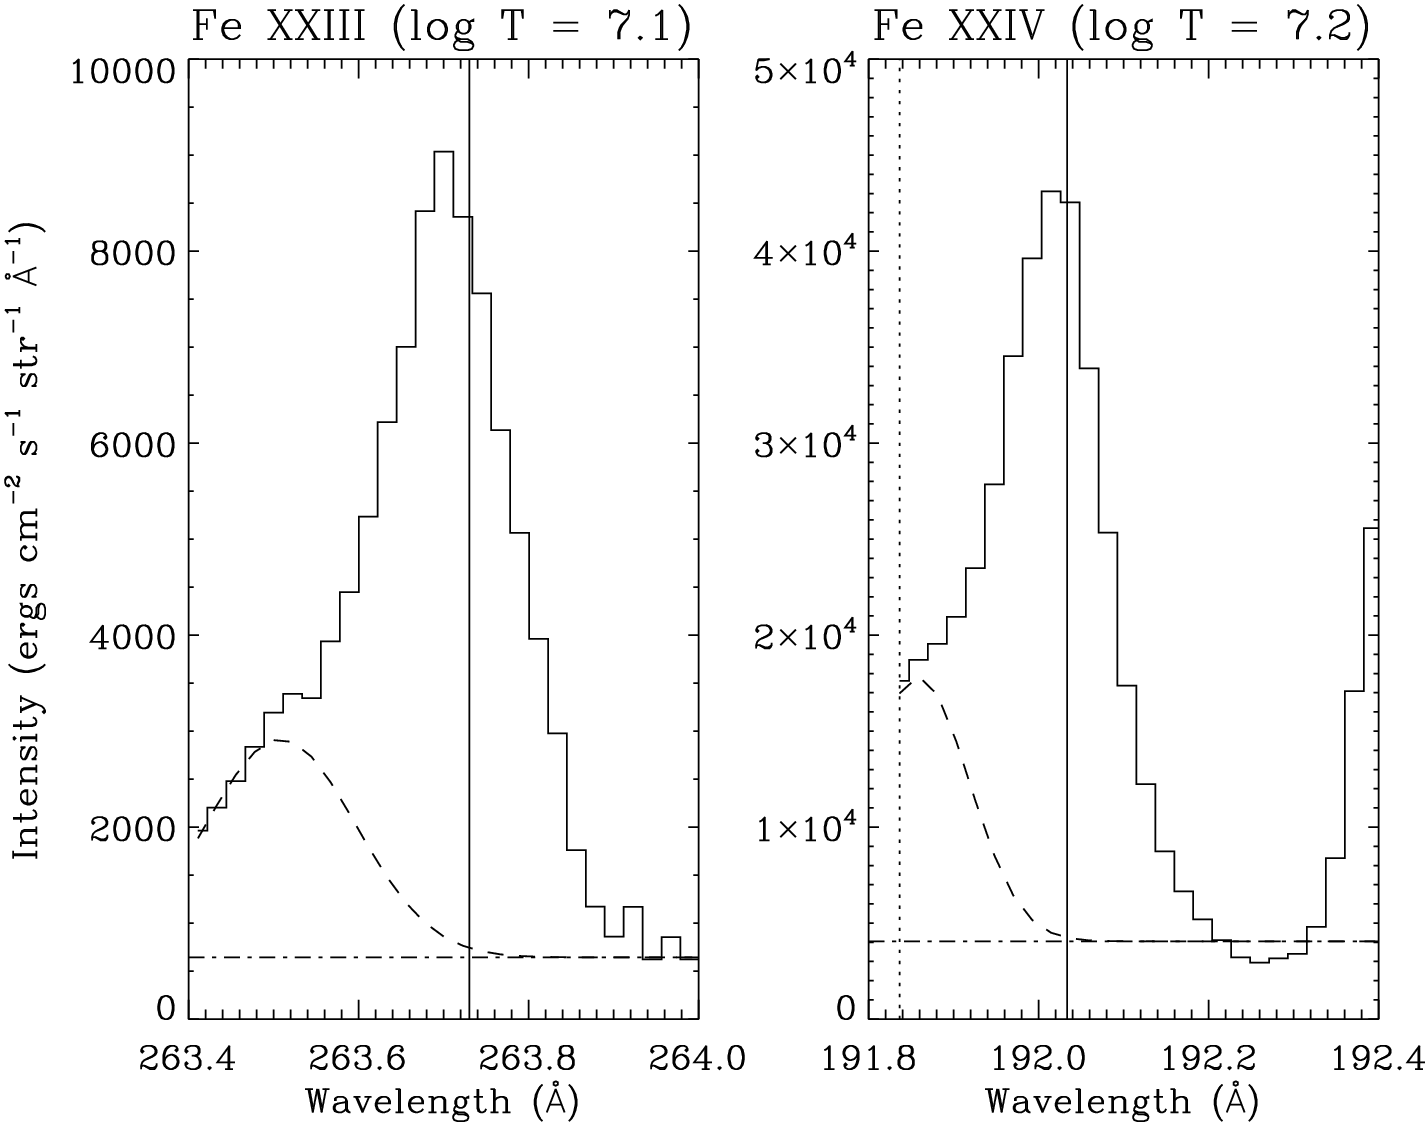
Perhaps an even more unexpected result of this analysis was that the
line profiles taken from the footpoints for the two hottest lines (Fe
XXIII, 12 MK and Fe XXIV, 16 MK) were both dominated by stationary
components despite exhibiting upflows >250 km/s (
Figure 4). Many flare
heating models predict that any chromospheric material heated during
the impulsive phase should rise due to the pressure gradient relative to the overlying
corona. The corresponding line profiles should therefore be completely
shifted, which was the case for all other lines in this
event. Comparisons made with other, similar events will reveal
whether this was a unique, one-off case (perhaps some unresolved
magnetic structure confined the hottest material at rest) or whether
there is a flaw in our understanding of the evaporation process.
Figure 4:
Fe XXIII and Fe XXIV line profiles from the brightest
footpoint pixel, within the HXR contours. The solid vertical line
denotes the approximate rest wavelength of each line. Note that both line profiles
are dominated by a near-stationary component while the dashed lines mark
the fits to the highly blueshifted components. » Click figure to see full-size image.
Conclusions
Despite the recent quiescent period of solar activity EIS is providing
a unique insight into the effects of electron beam heating in the
chromosphere during solar flares. Coordinated observations
between EIS and RHESSI during Cycle 24 can be used to diagnose the
temporal variations of this beam heating, as well as nonthermal line broadening and density variations.
References:
1. Milligan & Dennis (2009), ApJ, 699, 968