The datasets for EIS Data Compression (DC) factor investigation are chosen as follows:
1. search EIS study database to find out which study has adopted a specific compression scheme such as DPCM, JPEG95, etc. For example, study 29, 30, 31, 32, 91, 92, 142, 255, 258 have ever used JPEG90 compression scheme.
notes:
- study 29-32 are designed specially for all of compression schemes test, however, only study 29, 30 have generated useful fits files. Also the selection of compression scheme was done in eis_mk_study tool, rather than eis_mk_raster, thus there was no scheme information in these fits header. In this case one needs to manually find out the scheme for every fits files by study 29, 30.
- Some studies use multiple rasters (eg. study 142), for convenience of MDP data packets calculation the investigation only focuses on single-raster studies.
- Check the txt files study_summary.txt for more information about studies and their compression scheme selections.
2. Once knowing details (eg. ID) of rasters, which using a specific compression scheme, one can extract original data volume for these rasters (through EIS planning database), and the corresponding fits files (through EIS science database), then work out the data set for the investigation. The file datasets_list.txt lists the datasets used in this case.
notes:
- The datasets chosen here are out from EIS eclipse season
- In the 'plot' figures shown below, data points towards right-side of X-axis imply themselves coming from more recently observations.
The way to calculate EIS on-board compressed data volume with MDP status curves was described in previous post abut EIS DC factor: check it here.
The following links show DC factor variation in different scenarios (eg. AR, QS for SCI_OBJ, 1", 2", 40", and 266" for SLA).
A conservative estimation of average factor is indicated by orange dash-line on the plot, which could be used to improve EIS planning tools.
note:
EIS Data Compression (DC) factors listed here are only for Science Target & Slit/Slot selection. For factor variation upon exposure time, please refer H. Hara's 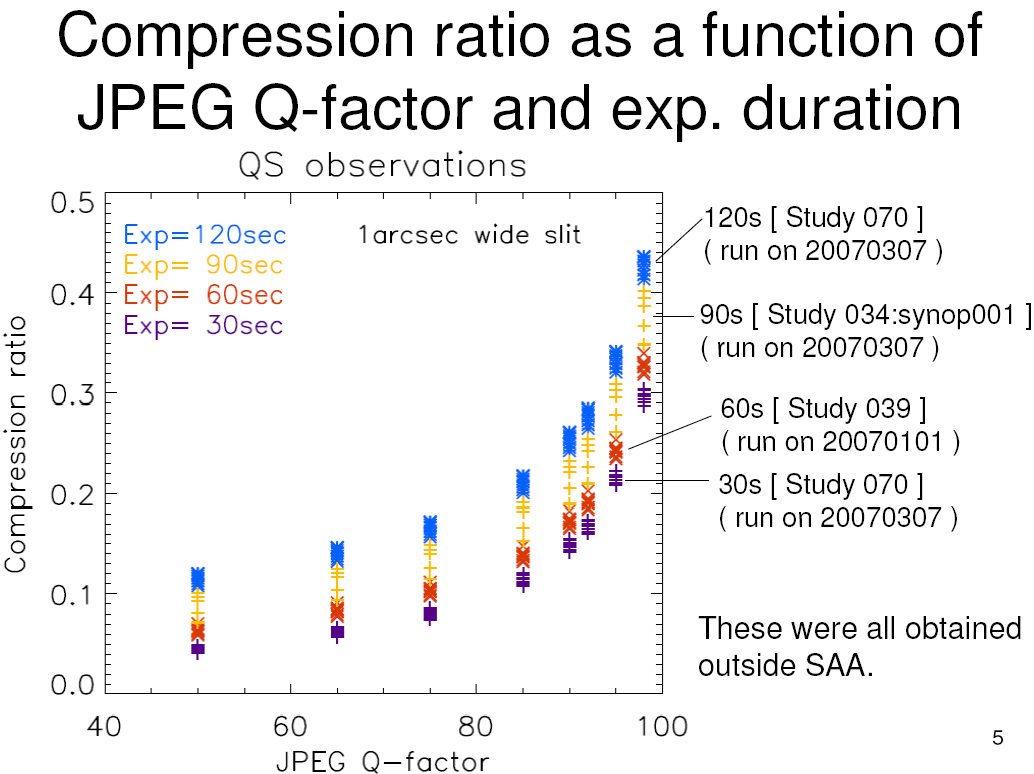 , (PDF)
For easy analysis a data table can be worked out as follows, using the plots shown in above links:
| Scheme | Total | QS | AR | CH | 1" | 2" | 40" | 266" |
|---|---|---|---|---|---|---|---|---|
| DPCM | 2.12 | 2.19 (2.38) | 2.19 | 2.19 | 2.54 | 2.46 | 2.19 | 2.18 |
| JPEG98 | 2.60 | 2.46 | 2.22 | 3.15 | 2.85 (avg) | 2.31 | 2.28 (2.32) | |
| JPEG95 | 3.02 | 3.64 | 3.26 | 6.12 | 6.38 (6.54) | 3.26 | ||
| JPEG92 | 3.45 | 3.31 (avg) | 6.65 (avg) | 2.74 (avg) | 6.53 (avg) | 2.74 (avg) | 3.63 (avg) | |
| JPEG90 | 4.01 | 3.82 | 4.34 | 3.73 | 4.67 (avg) | 3.84 | 3.78 | |
| JPEG85 | 4.79 | 4.82 | 4.51 | 4.91 | 3.9 (avg) | 4.51 | ||
| JPEG75 | 5.89 | 6.2 | 18.88 (avg) | 6.2 | 7.52 | |||
| JPEG65 | 7.38 | 19.94 (avg) | 25.97 (avg) | 7.33 (avg) | ||||
| JPEG50 | 9.39 | 20.98 | 17.72 | 35.37 (avg) | 17.72 |
Using DC factos (ie. 'total' in above table) to do trend fitting and compare wth those previous numbers used in EIS planning tool, we have:
total EIS DC factor:
| DPCM | JPEG98 | JPEG95 | JPEG92 | JPEG90 | JPEG85 | JPEG75 | JPEG65 | JPEG50 |
|---|---|---|---|---|---|---|---|---|
| 2.19 | 2.33 | 3.26 | 3.63 | 3.82 | 4.51 | 6.20 | 7.33 | 9.36 |
previous EIS DC factor:
| DPCM | JPEG98 | JPEG95 | JPEG92 | JPEG90 | JPEG85 | JPEG75 | JPEG65 | JPEG50 |
|---|---|---|---|---|---|---|---|---|
| 2.36 | 2.70 | 3.47 | 4.22 | 4.63 | 5.74 | 7.63 | 9.43 | 12.00 |
For full history of EIS compression factor, see: this page
 |
The orange dash-line in the figure can be described using equation: Y = 2.11768 + 0.556287*X - 0.0855122*X2 + 0.0161953*X3
Thus, the corresponding numbers on the line are:
| DPCM | JPEG98 | JPEG95 | JPEG92 | JPEG90 | JPEG85 | JPEG75 | JPEG65 | JPEG50 |
|---|---|---|---|---|---|---|---|---|
| 2.12 | 2.60 | 3.02 | 3.45 | 4.01 | 4.79 | 5.89 | 7.38 | 9.39 |
Some comments:#
However in this calculation it looks that there is difference, but not too big, of compression factor in different scenarios, especially for example the DPCM compression (values are close to 2.19). This gives an idea we may use a set of single value of EIS compression factor for simplicity.
- we got much more data points to cover all compression schemes (see datasets used in this calculation.
- the start-time & end-time in some fits headers are not corresponding to the time on MDP data packet curve
- For example, from eis_l0_20080501_054833.fits.gz header:
strat: 2008-05-01T05:48:33
end: 2008-05-01T05:50:03
 |
It's clear that: if using start-time & end-time in fits header, then the calculated MDP data volume is 0; if using raster duration to get end-time, only partial MDP data packets will be counted; using study duration seems fine to get completed data volume.
Another example: eis_l0_20080501_190013.fits.gz:
start: 2008-05-01T19:00:13
end: 2008-05-01T19:01:35
 |
For this fits file, if using start-time & end-time in fits header, then only half MDP data packets are counted, which making compression factor double; if using raster duration and study duration to get end-time, both will get completed data volume and generate reasonable compression factor.
This mismatch, ie. the data coming is slower than the expection, might explain MDP data recorder full on-board, for example, in the case that EIS data packets for previous and current studies are coming very close in time!
compFactor={compression_factor, $
          study_ACR     :'', $  ;string
          study_id      :'', $  ;string
          rast_ACR      :'', $  ;string
          rast_id       :'', $  ;string
          ll_ACR        :'',$   ;string
          ll_id         :'',$   ;string
          start_time    :'', $  ;string
          end_time      :'', $  ;string
          fitsname      :'',$   ;string
          target        :'',$   ;string
          sci_obj       :'',$   ;string
          slit          :'',$   ;string
          def_volume    :0LL,$  ;long64 int, unit: bits
          mdp_volume    :0.0,$  ;float, unit: kbits
          comp_scheme   :0,$    ;int
          nexp          :0,$    ;int
          rast_req      :0,$    ;int
          exposures     :fltarr(8) $    ;float, unit: sec
        }
I attached an IDL sav file. You may download and play it, for example, I use:
if (str1[i].SCI_OBJ eq 'QS') && (str1[i].COMP_SCHEME eq 1) && (str1[i].MDP_VOLUME gt 0.) then ind[i]=1
to extract records associated with 'QS' SCI_OBJ and using DPCM compression scheme.
JianSun (MSSL) - 2008-06-09
1. From 2008-06-21 to 2008-06-26, EIS ran a series of studies to test compression schemes of DPCM, JPEG90, JPEG85 & JPEG75.#
- The compression factor for each scheme during these tests have been calculated by using the following equation:
- * original_volume: obtained from the definition files of EIS compression studies (ID: 288, 289, 290, 291, 53100 KB in this case).
- * mdp_volume: extracted from EIS MDP status fits files.
2. Check this page to see the corresponding fits files, compression schemes, slit/sci.obj, original volume, mdp volume and compression factor.#
3. Compression factor:#
- *DPCM scheme testing has generated 7 fits files, and the compression factors are as follows:
2.59747  2.58256  2.57117  2.60936  2.58829  2.66812  2.581

range: 2.57117 ~ 2.66812
currently in planning tool: DPCM: 2.19 (AR) + 0.2 (slit) = 2.39
adjust to: 2.58 (?)
- JPEG90 has generated 8 fits files, and the compression factors are as follows:
3.50601  3.49550  3.39017  3.44851  3.64140  3.42182  3.52820  3.57641}}

range=: 3.39017 ~ 3.64140
currently in planning tool: DPCM: 3.80 (AR) + 0.1 (slit) = 3.90
adjust to: 3.50 (?)
- JPEG85 has generated 26 fits files, and the compression factors are as follows:
4.13710 4.13043 4.03683 4.07790 4.00781 4.05085 4.08570 4.05598 4.04064 4.11058 4.16667 4.16261 4.15587 4.21321 4.20492 4.21044 4.14780 4.20492 4.09091 4.05598 4.29073 4.03556 4.09875 4.11850 4.13310 4.22570

range=: 4.00781 ~ 4.29073
currently in planning tool: DPCM: 4.51 (AR) + 0.2 (slit) = 4.71
adjust to: 4.05 (?)
- JPEG75 has generated 7 fits files, and the compression factors are as follows:
5.20284 5.06117 5.08727 5.10549 5.11976 5.27127 5.07519

range=: 5.06117 ~ 5.27127
currently in planning tool: DPCM: 5.80 (AR) + 0.0 (slit) = 5.80
adjust to: 5.09 (?)
4. Note:#
There are no compression tests for Slot & QS target cases.
JianSun (MSSL) - 2008-07-07