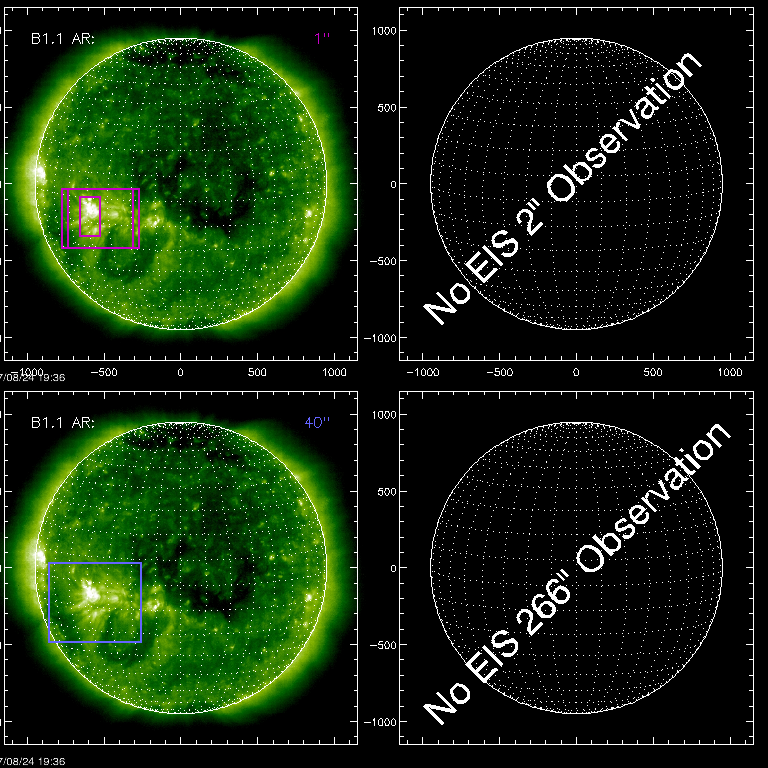
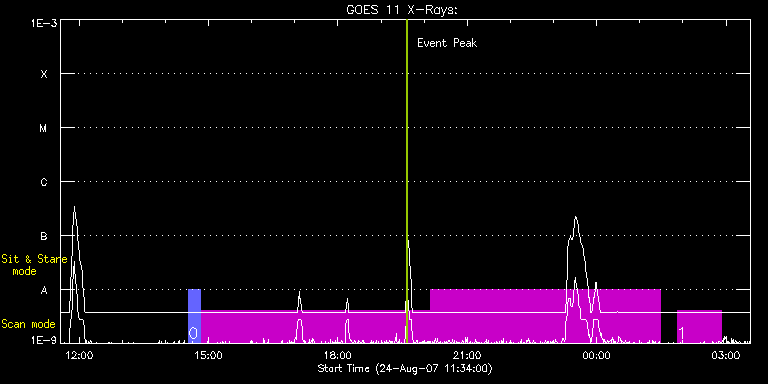
EIS Observation timeline overlay to GOES-Xray curve Code 1" 2" 40" 266" EIS Observations list for this event: STUDY ACRONYM ID DATE OBSERVED DESCRIPTION NOAA# TARGET 0 AR_velocity_map_v2 | 4385 | 2007/08/24 14:32:34 | Detailed, large format active region m | 969 | Active Region TIMELINE ID DATE OBSERVED FITS FILE XCEN (+W/-E) YCEN (+N/-S) DUR ----------------------------------------------------------------------------------------------------------------- 4385 | 2007/08/24 14:32:34.000 | eis_l0_20070824_143234.fits.gz | -559.61 | -227.46 | 16m49s 4385 | 2007/08/24 14:49:34.000 | eis_l0_20070824_144934.fits.gz | -540.94 | -227.60 | 5h19m31s 4385 | 2007/08/24 20:09:12.000 | eis_l0_20070824_200912.fits.gz | -500.84 | -231.23 | 5h19m32s 1 HPW008_FULLCCD_v2 | 4386 | 2007/08/25 01:51:52 | HPW008_FULLCCD_RAST_128x256_25s_SLIT1_ | 969 | Active Region TIMELINE ID DATE OBSERVED FITS FILE XCEN (+W/-E) YCEN (+N/-S) DUR ----------------------------------------------------------------------------------------------------------------- 4386 | 2007/08/25 01:51:52.000 | eis_l0_20070825_015152.fits.gz | -587.24 | -214.11 | 1h1m32s : Check study information : Download file : View thumbnails For this event, also check for:
EIS Observations list for this event:
For this event, also check for:
 Hinode/EIS HomeAll Years2006 | 2007 | 2008 | 2009 | 2010