As reported in a previous EIS nugget (Sensitivity Performance of the Extreme-ultraviolet Imaging Spectrometer (EIS) on Hinode,
January 2011) the sensitivity loss (due to contamination) of the EIS instrument is measured by monitoring the intensities of
solar spectral lines, e.g. He II at 256.32 Å, in the quiet Sun. In addition to this the contamination levels for EIS are monitored
using QCM (Quartz Crystal Microbalance) data. The QCM consists of a quartz crystal resonator whose frequency change is
measured - any contamination will cause a reduction in the frequency due to mass deposition at the surface of the resonator.
Also, flat-field intensity data (using the EIS LEDs) is used to identify whether there is any contamination on the EIS detectors.
QCM measurements
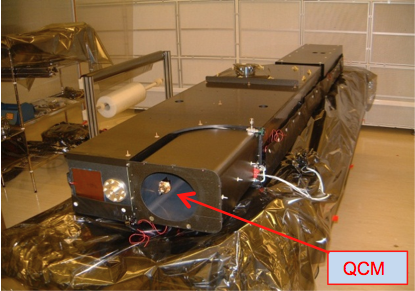
The photo on the left shows the EIS QCM located at the entrance aperture as shown on the flight model during assembly at RAL (the entrance baffle
had not been fitted at the time of this photo).
The QCM readings for EIS have been taken at weekly intervals since launch and provide an indication of the contamination levels of the EIS instrument.
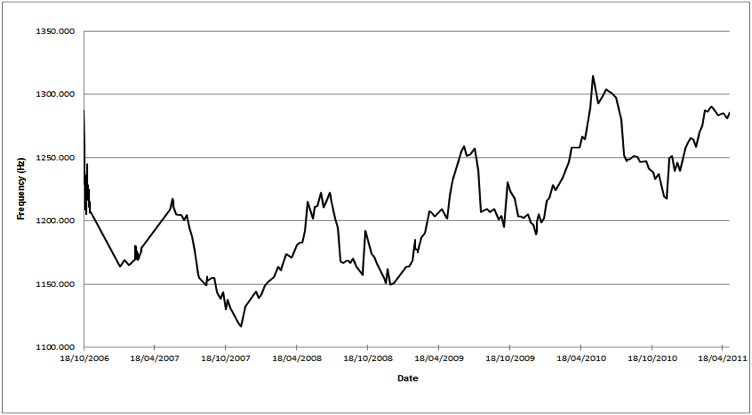
The QCM results show a slight increase year-on-year (
Figure 1) which is to be expected and confirms that contamination levels for EIS are at a minimal level.

Figure 1: EIS QCM2 (external position) normalised for temperature.
Note: The periodic nature of the mass loading (frequency) is as a result of the annual temperature variations.
» Click figure to see full-size image.
Flat-field intensity levels
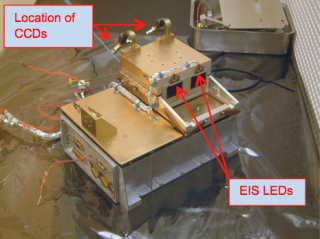
The EIS LEDs are situated in front of the CCDs above the aperture windows, as shown on the right (flight model during assembly, CCDs not fitted at the time of this photo). These are blue LEDs which were chosen as their wavelength range has a similar absorption depth in silicon as the wavelength range of EIS (from the range of LEDs which were available at the time of selection). Once a month the EIS LEDs are switched on and short exposures (one second duration) are taken.
The intensity levels of these exposures are compared - any significant change (e.g. a decrease in intensity level) could indicate that contamination levels have increased on the detectors. Results to date show that the sensitivity levels have not changed significantly (
Figure 2), suggesting that there is only negligible (if any) contamination on the CCDs and that any contamination is on the other optical components (e.g. mirror).
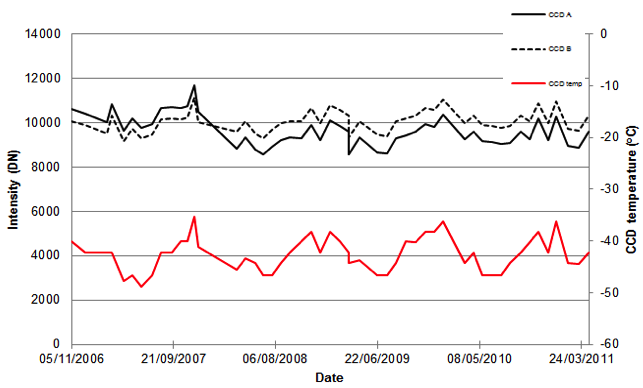
Figure 2:
The flat-field intensity levels (since launch) for the EIS detectors using EIS LEDs (averaged over a 450 x 450 pixel area). The upper two lines represent the intensity levels for the long (CCD A) and short (CCD B) wavelength detectors. The lower line represents the CCD temperature. It can be seen that the variations in the intensity levels coincide with temperature fluctuations.
It is important to monitor the flat-field intensity levels for EIS as if a significant decrease is seen this could indicate a contamination problem and a recommendation can be made as to whether a CCD bake-out is required (note: if the contamination is not on the CCDs a bake-out will provide no improvement to the sensitivity levels). To date a bake-out has not been required which is a great result for EIS as it is now in its fifth year of operation.