A key piece of evidence for chromospheric evaporation during the
impulsive phase of flares is an upward velocity around 100 km/s or
more in plasma at temperatures near 10 MK. This has been observed
for about 35 years with satellite-borne, uncollimated soft X-ray
spectrometers. Interestingly, with few exceptions the soft X-ray
spectra at flare onset show that the whole line profile is not
blueshifted, but consists of a blueshifted component accompanied by
an intense stationary component. This is inconsistent with
theoretical models of chromospheric evaporation in single-strand
loops. The discrepancy appears to be resolved by models that
incorporate multiple strands within the flare loop envelope (Hori et
al. 1998, Doschek & Warren 2005, Warren & Doschek 2005, Warren
2006). In this scenario upflows of several hundred km/s occur at the
onset of evaporation within each strand, but will be observed as a
blueshift of the whole line profile only while the very first strand
is filling with evaporated material. Upflows in subsequent strands
are observed as blue wing enhancements of the intense stationary
component, where the stationary component is due to emission from
strands that have already been filled with evaporated plasma. (If all
of the loop strands could be individually resolved, the whole line
profile would appear blueshifted during evaporation in each of them.)
To date the soft X-ray spectrometers seem not to be sensitive enough
to observe evaporation in the very first loop strand at flare onset.
Brosius (2001) developed a rapid cadence (9.8 s) stare study to
observe EUV emission lines formed over a wide range of temperatures
in spatially resolved 4" X 20" CDS slit segments. Brosius (2003) and
Brosius & Phillips (2004) observed M flares with this study and found
that the entire single-component Fe XIX profile was blueshifted
during the impulsive intensity rise, consistent with chromospheric
evaporation theory. To capitalize on the higher spatial and spectral
resolution of Hinode's EIS, we designed the rapid cadence (11.18 s)
FLAREDOP_EIS study after its CDS counterpart. FLAREDOP_EIS includes
the unblended Fe XXIII line at 263.8 A, formed at temperature around
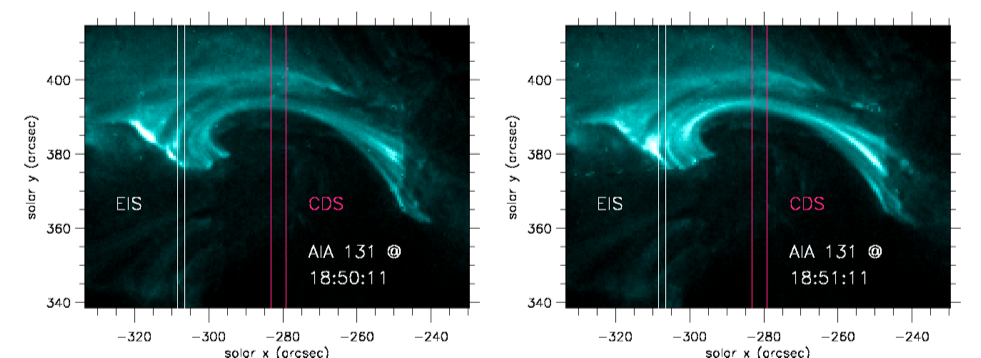
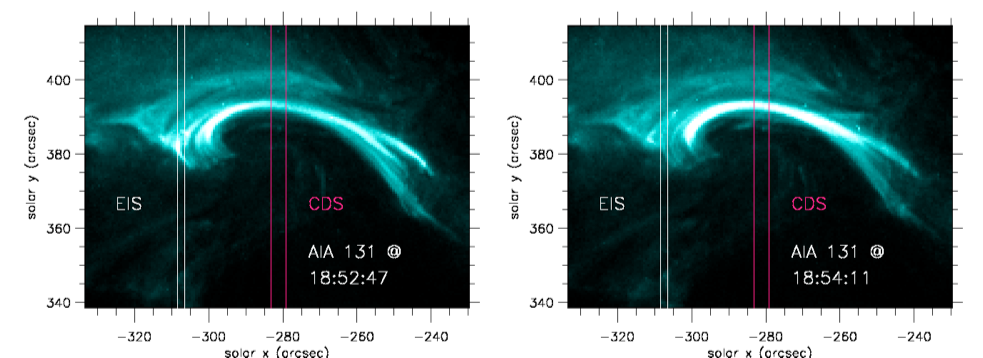
14 MK. In this Nugget we summarize results from a run of
FLAREDOP_EIS when the slit stared at the leg of a C1 flare loop. See
Figure 1. For more information about this EIS and coordinated CDS
observing run, see Brosius (2013).
The entire profile of the Fe XXIII line at 263.8 A was blueshifted by
an upward (negative) velocity -122+/-33 km/s when the line was first
detected by EIS during the flare. The entire profile became even
more blueshifted over the next two exposures, when the upward
velocity reached its largest value of -208+/-14 km/s before
decreasing to zero over the next 12 exposures. After that, a weak,
secondary blueshifted component appeared for 5 exposures, reached a
maximum upward velocity -206+/-33 km/s, and disappeared after the
maximum line intensity (stationary plus blueshifted) was achieved.
See Figure 2. Velocities were measured relative to the intense
stationary profile observed near the flare's peak and early during
its decline. The initial episode during which the entire profile was
blueshifted lasted about 156 s, while the following episode during
which a secondary blueshifted component was detected lasted about 56
s. See Figure 3. We attribute the first episode to chromospheric
evaporation in a single loop strand, and the second to evaporation in
an additional strand, as described in multi-strand flare loop models
mentioned above. Line emission from progressively cooler ions (Fe
XVII, XVI, and XIV) brightened at successively later times, as
expected during cooling of flare-heated plasma. See Figure 4.
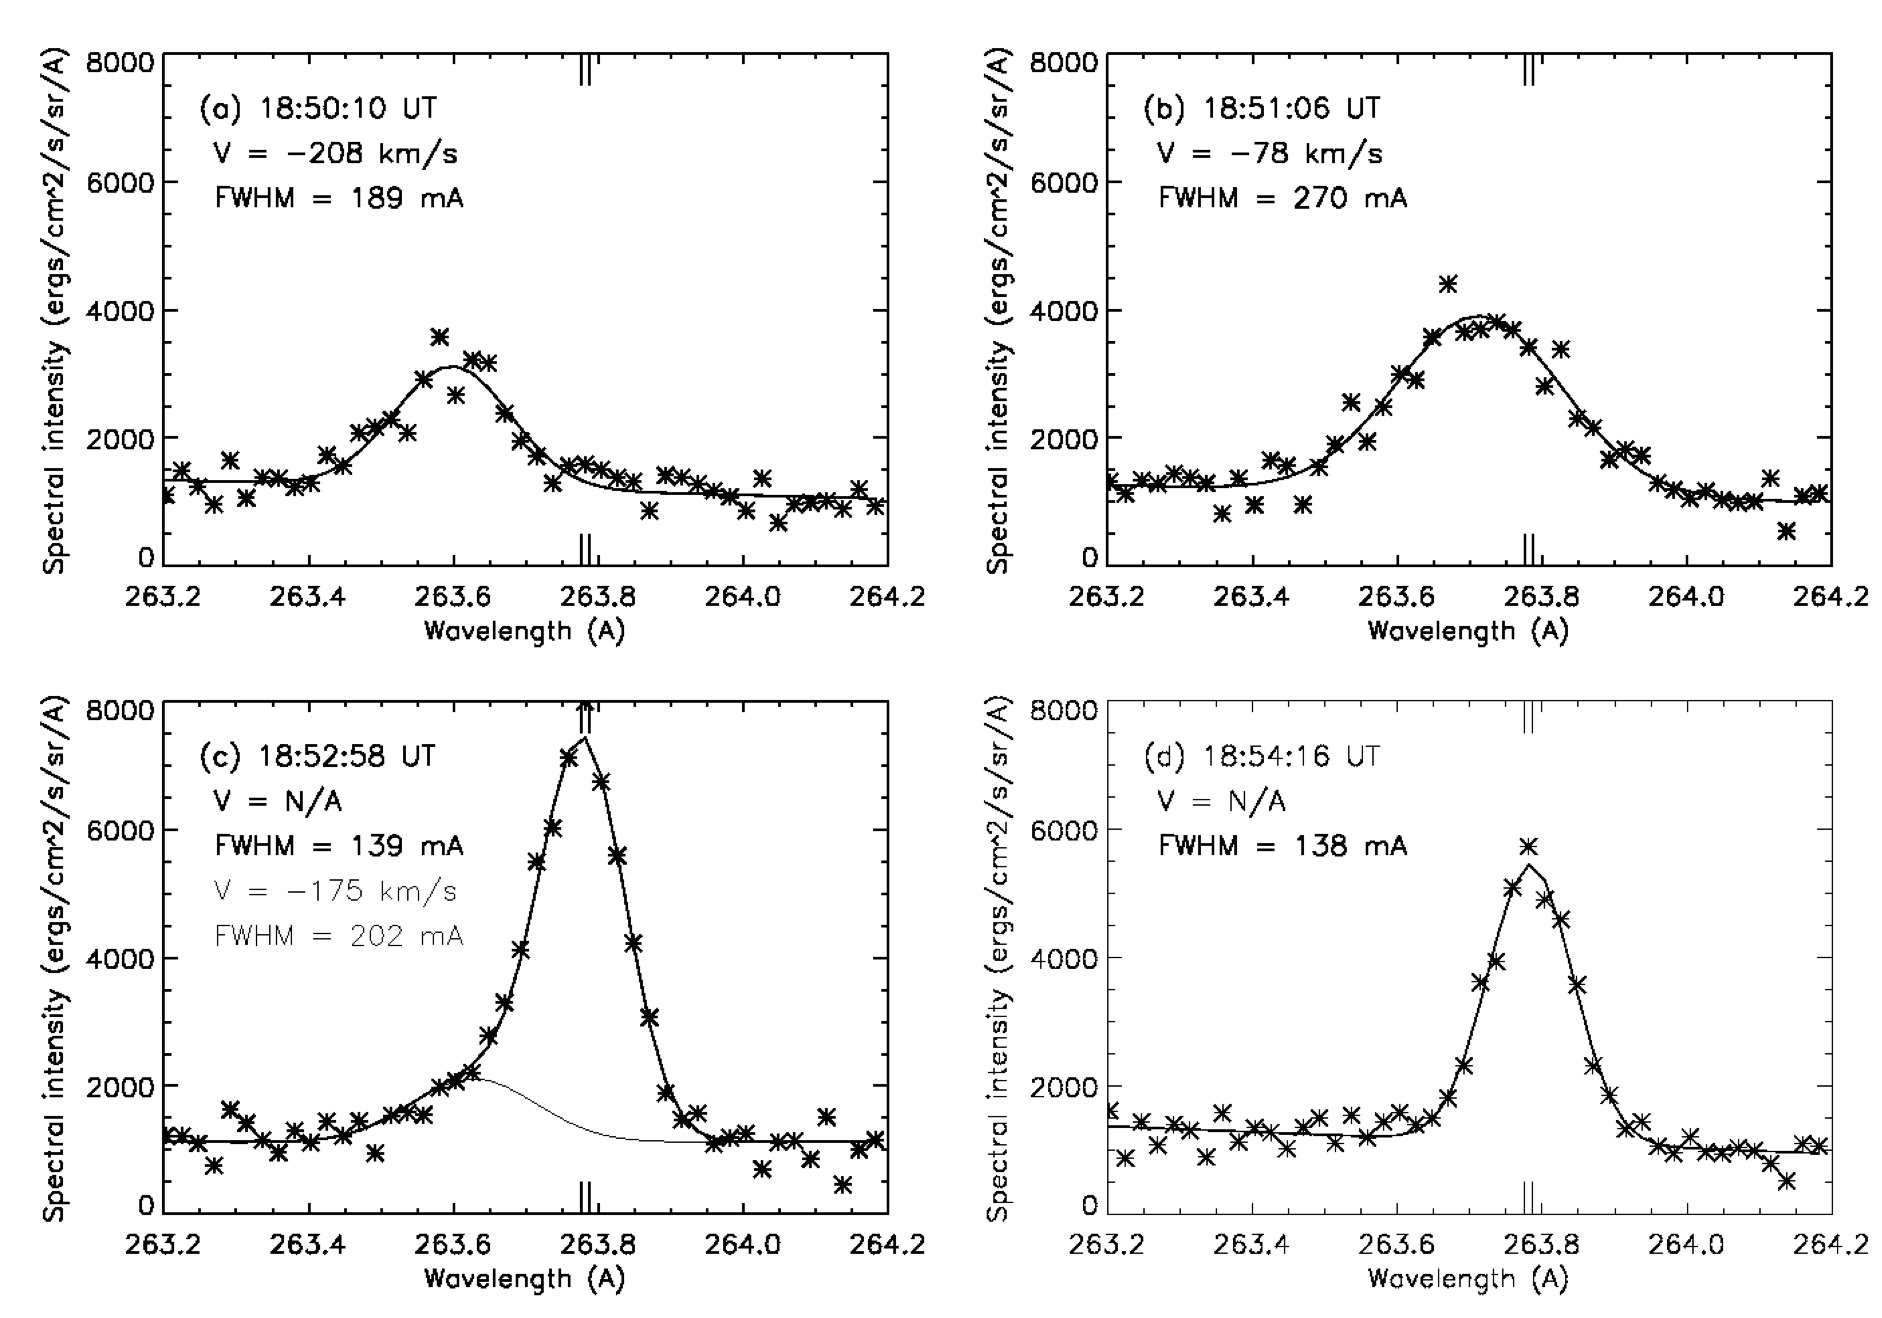
Figure 2: Fe XXIII line profile fits at selected times (upper left) during the
flare. Frame (a) shows the profile with the largest upward relative
Doppler velocity during the flare's impulsive rise; this is the 3rd
EIS exposure with significant Fe XXIII emission. Frame (b) shows the
profile from the 8th EIS exposure during the flare, by which time the
upward velocity had decreased substantially. Note that the entire
profile is blueshifted in these two frames. Frame (c) shows the
profile from the 4th exposure with a significant secondary,
blueshifted component; here the main component is at relative rest.
Frame (d) shows a profile during the "reference" period after the
flare's peak intensity; this is one of the exposures used to derive
the rest wavelength and its uncertainty (1-sigma scatter, which
corresponds to an uncertainty of 6.4 km/s on the reference
wavelength). The extra-long vertical tic marks at the top and bottom
of each frame indicate +/- 1-sigma about the reference wavelength.
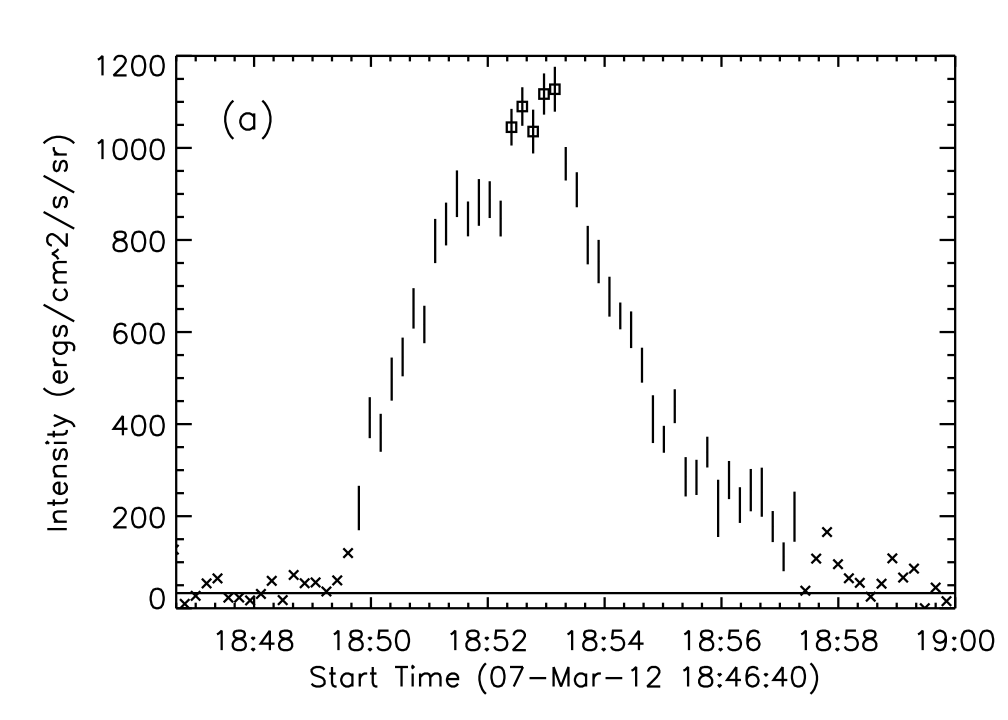

Figure 3: (a) Light curve and (b) relative Doppler velocity plot for the Fe
XXIII line at 263.8 A observed by EIS. Intensities displayed as
vertical error bars only (with no symbols) are derived from exposures
in which only one component to the emission line is observed;
intensities displayed as boxes represent the sum of a main component
(at rest) and a secondary blueshifted component; intensities
displayed as X's correspond to exposures in which no Fe XXIII
emission is detected (we fit the noise; statistical uncertainties are
larger than the plotted intensities). Velocities displayed as
asterisks with vertical error bars indicate exposures used to derive
the reference (rest) wavelength and its 1-sigma scatter; velocities
displayed as vertical error bars only (no symbols) are derived from
exposures with significant Fe XXIII emission; those displayed as
boxes correspond to the secondary, blueshifted component observed in
five EIS exposures.
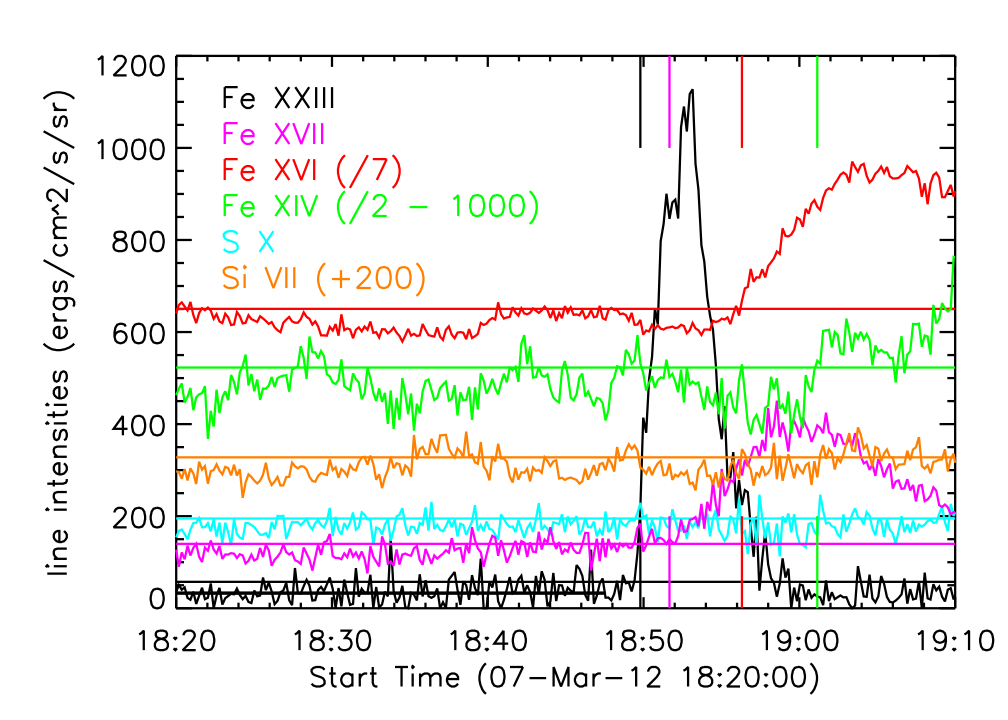
Figure 4: Light curves derived from the EIS spectra averaged over five 1-arcsec
y-pixels along the slit around the spatial center of the flare.
Color coded horizontal lines indicate the pre-flare intensity
averaged over the first 171 exposures in the sequence (indicated with
the thicker, shorter black horizontal line) plus the 1-sigma scatter
over the same exposures. The flare starts in Fe XXIII emission at
18:49:48 UT (indicated with long black vertical tick marks), in Fe
XVII at 18:51:40, in Fe XVI at 18:56:19, and in Fe XIV at 19:01:09
UT. S X and Si VII do not participate in the flare at the location
of the EIS slit.
References
---------------
Brosius, J. W. 2001, ApJ, 555, 435
Brosius, J. W. 2003, ApJ, 586, 1417
Brosius, J. W. 2013, ApJ, vol. 762, in press
Brosius, J. W., & Phillips, K. J. H. 2004, ApJ, 613, 580
Doschek, G. A., & Warren, H. P. 2005, ApJ, 629, 1150
Hori, K., Yokoyama, T., Kosugi, T., & Shibata, K. 1998, ApJ, 500, 492
Warren, H. P. 2006, ApJ, 637, 522
Warren, H. P., & Doschek, G. A. 2005, ApJ, 618, L157