Introduction:
Solar mass eruptions such as CMEs and EUV jets have rarely been investigated with spectroscopic observations. Recent EIS observations have demonstrated that EUV spectroscopy can be powerful in diagnosing dynamics and plasma properties during solar mass eruptions (e.g., Harra et al. 2007, PASJ; Jin et al. 2009; Tian et al. 2012, ApJ).
Plasma properties and dynamics of the CME ejecta and EUV jets:
It has been found that the profiles of emission lines formed at coronal and TR temperatures clearly exhibit two well-separated components in erupted CME loops and EUV jets (see examples of line parameter maps in Fig.1 and line profiles in Fig.2). Besides an almost stationary component accounting for the background emission, there is a strong and highly blueshifted (approx. 200 km/s) component representing emission from the erupting material.
The two components can often be easily decomposed through a double Gaussian fit. Different properties of the two components suggest the importance of separating emission from different sources when studying dynamic events. While in imaging observations it is usually difficult to separate the ejecta emission from the background emission. Thus, with spectroscopic observations, we can diagnose the electron density, perform a DEM analysis, and estimate the mass of the ejecta by eliminating the contamination of the background (see details in Tian et al. 2012). Moreover, the real speeds of the erupted CME loop and EUV jet can be calculated by combining the speed of the blueshifted component and the projected speed of the ejecta from simultaneous imaging observations.
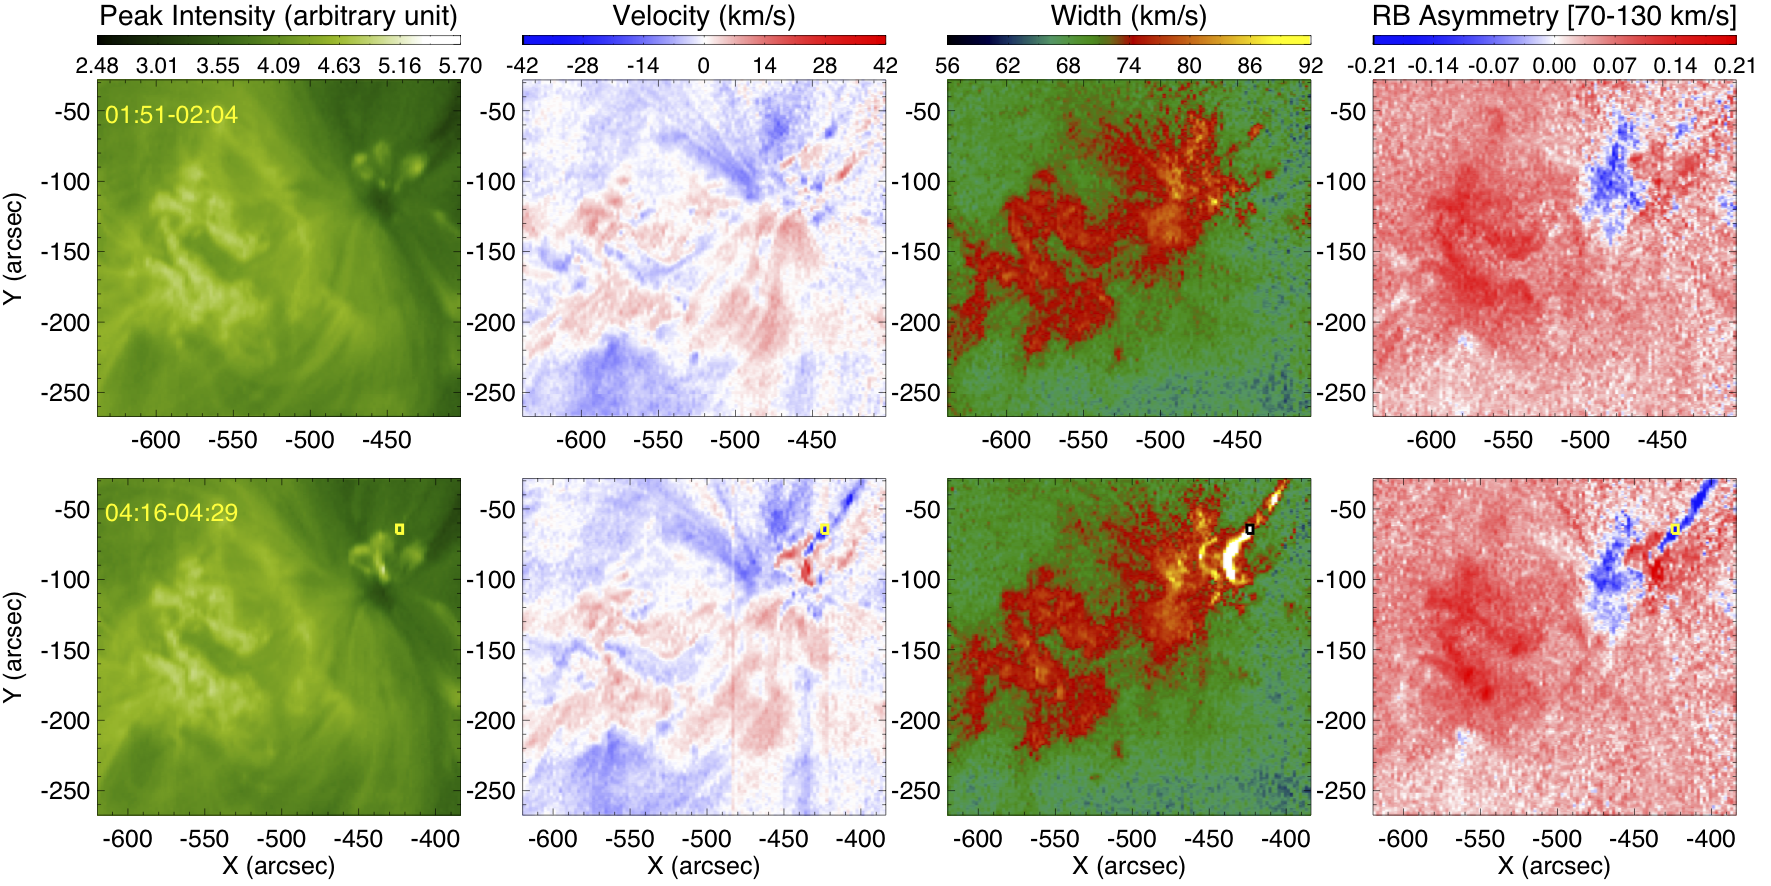
Figure 1: Spatial distributions of the peak intensity, Doppler velocity, and exponential width derived from the single Gaussian fit and the average RBp asymmetry in the velocity interval of 70-130 km/s for Fe XII 195.12 A before (upper) and during (lower) a jet.
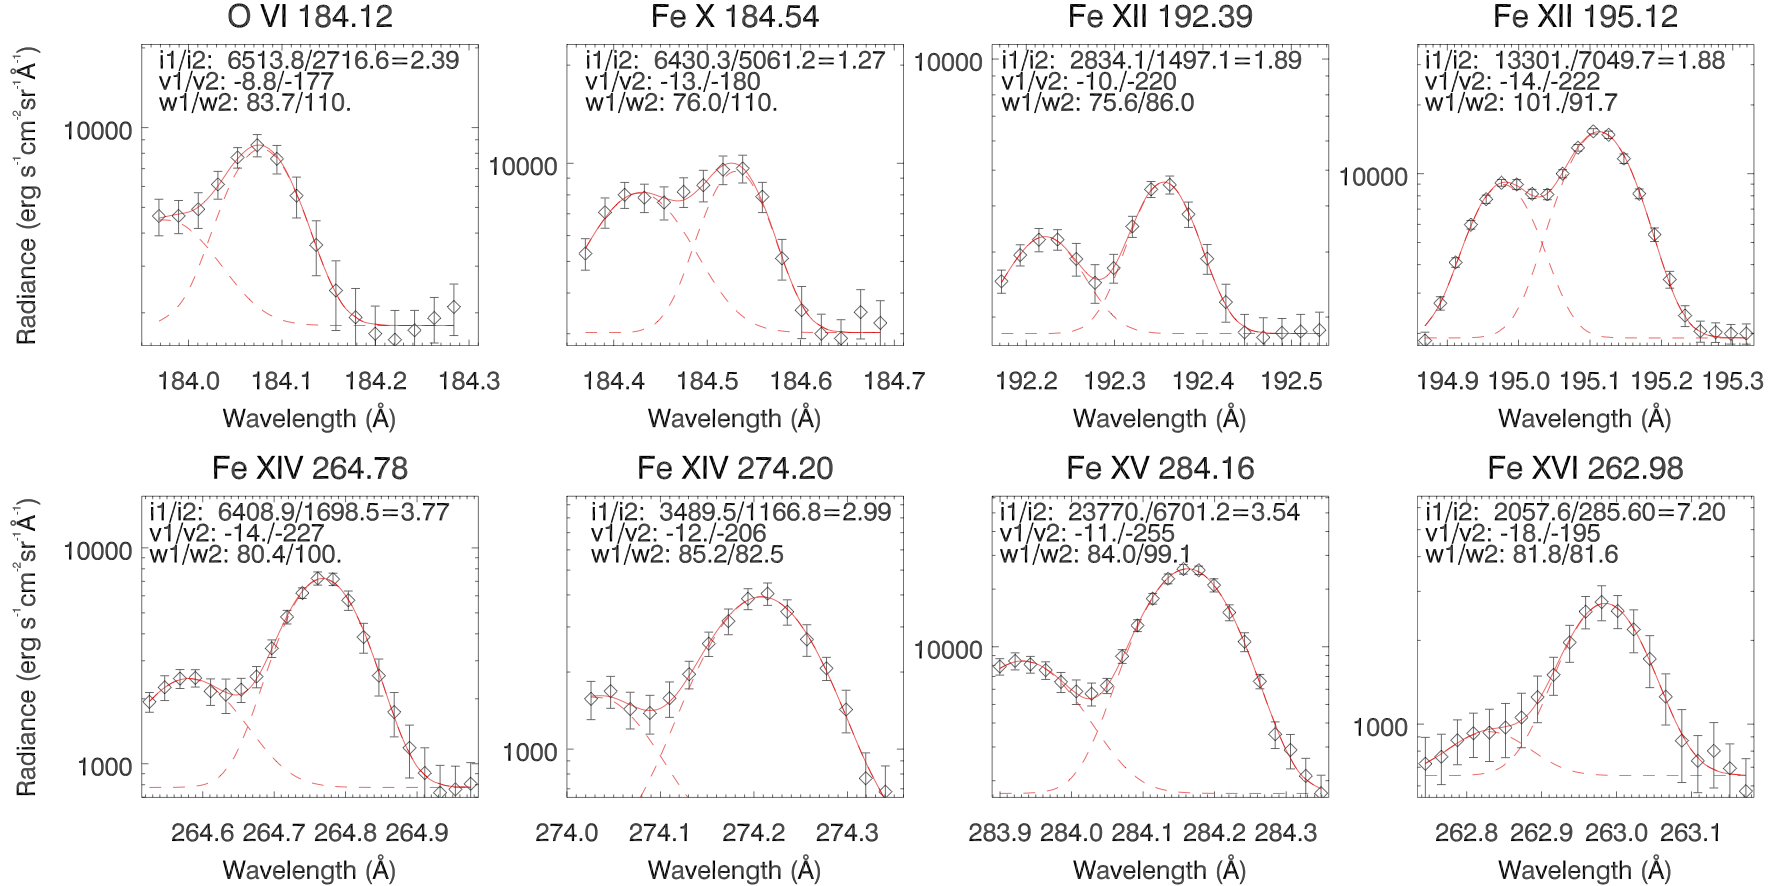
Figure 2: Line profiles observed in a CME. The observed spectra and measurement errors are shown as the diamonds and error bars, respectively. The two dashed red lines in each panel represent the two Gaussian components and the solid red line is the sum of the two components. The peak intensities (i1 and i2), velocities (v1 and v2), and exponential widths (w1 and w2) of the two Gaussian components are shown in each panel.
Plasma properties and dynamics of coronal dimmings:
As a CME leaves the Sun, sometime we see a decrease of the coronal emission. Such coronal dimmings have been found to reveal a blue shift of about 20 km/s from single Gaussian fit (e.g., Harra et al. 2007; Jin et al. 2009). Our detailed analysis (profile asymmetry analysis and double Gaussian fit) of the coronal line profiles clearly show blueward asymmetries in dimming regions (Fig.3), suggesting perhaps the presence of a relatively weak (approx. 10% of the total emission), high-speed (approx. 100 km/s) upflow component superimposed on a strong background emission component (Fig.4). We have found that both the blueshift and line width correlate very well with the blueward asymmetry, suggesting that the significant blue shift and enhanced line width are actually largely caused by the superposition of the two components. This finding suggests that a small portion of the plasma in the dimming region is flowing outward at a velocity of the order of 100 km/s.
Properties of these high-speed outflows are very similar to those from active region boundaries. Part of these weak, high-speed outflows may provide a significant amount of mass to refill the corona after the eruption of CMEs, and the other part may become solar wind streams impacting the kinematics of CMEs.
Our plasma diagnostics of the dimming region suggest that dimming is mainly an effect of density decrease rather than temperature change (Figs.5&6). The DEM diagnostics suggests that a significant portion of the plasma with a temperature of log (T/K) = 6.1-6.3 escaped when the magnetic field lines opened up. The mass losses in dimming regions have been estimated from two different methods, and they are 20%-60% of the masses of the associated CMEs, suggesting that a significant part of the CME mass indeed comes from the region where dimming occurs subsequently.
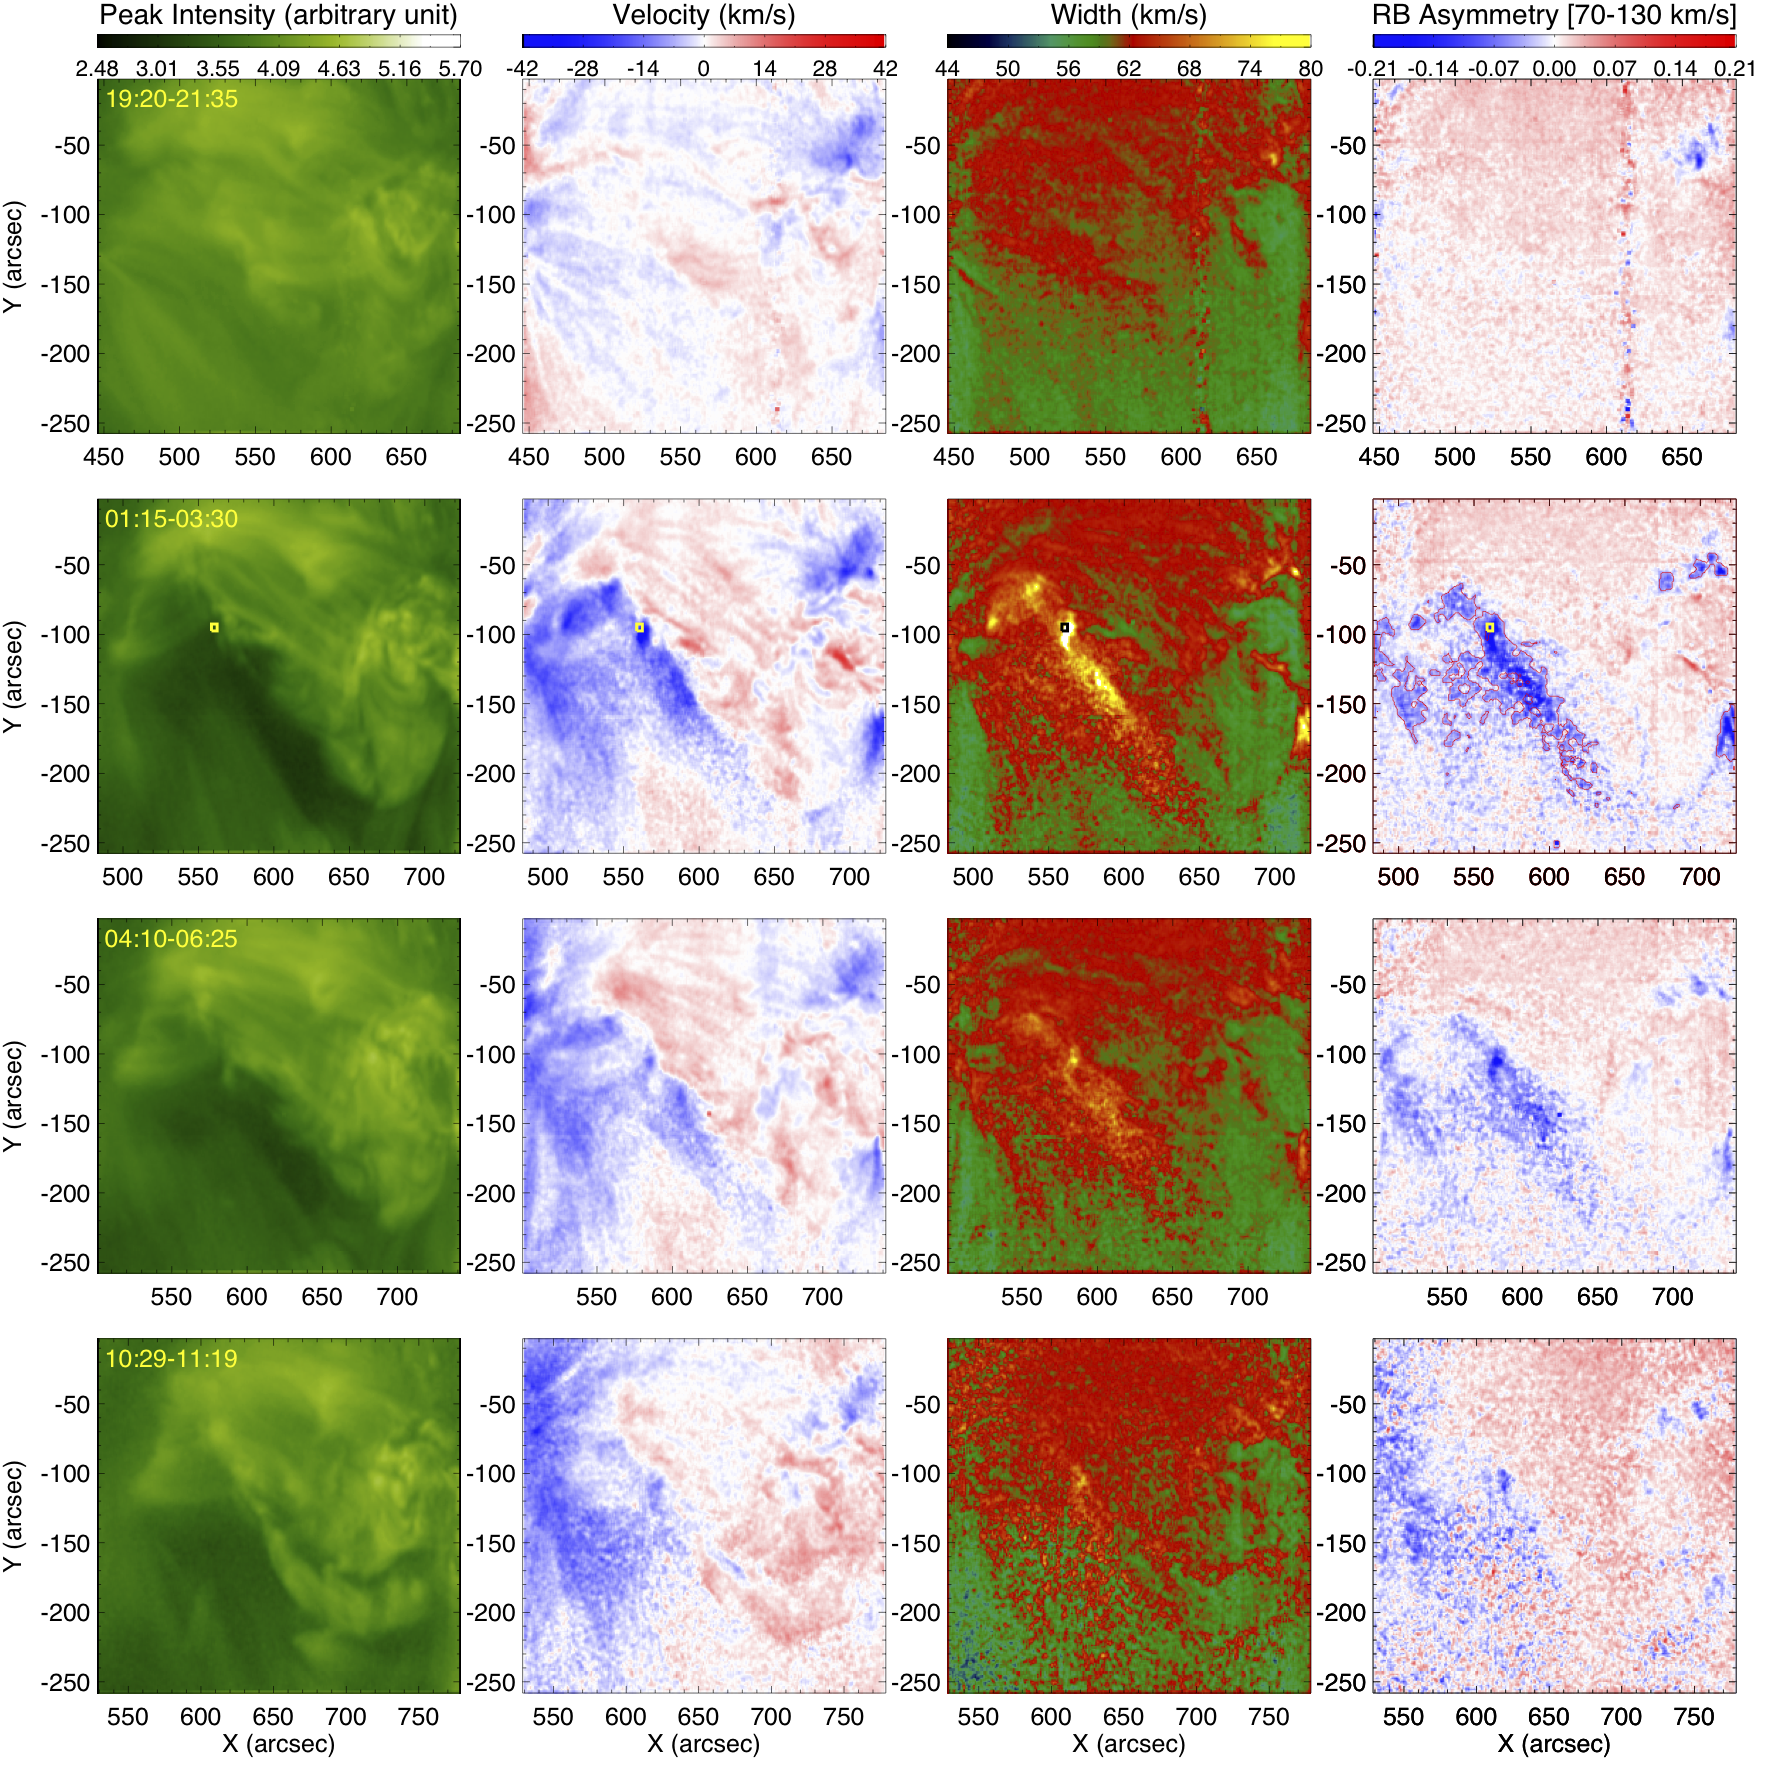
Figure 3: Spatial distributions of the peak intensity, Doppler velocity, and exponential width derived from the single Gaussian fit and the average RBp asymmetry in the velocity interval of 70-130 km/s for Fe XIII 202.04 A before (1st row) and during (other three rows) a dimming event.

Figure 4: RB asymmetry profiles (bottom) of 4 line profiles (top) averaged over the square marked in Fig. 3. Top: the observed spectra and measurement errors are shown as the diamonds and error bars, respectively. The green lines are single Gaussian fits. The two dashed red lines in each panel represent the two Gaussian components and the solid red line is the sum of the two. The velocity (v) and exponential width (w) derived from the single (SGF) and double (1st/2nd for the two components) Gaussian fits are shown in each panel. Also shown is the intensity ratio of the secondary component to the primary one (i2/i1). Bottom: the black and blue lines represent RB profiles for RBp and RBD, respectively. The peak relative intensity (i), velocity (v), and 1/e width (w) are shown in each panel.
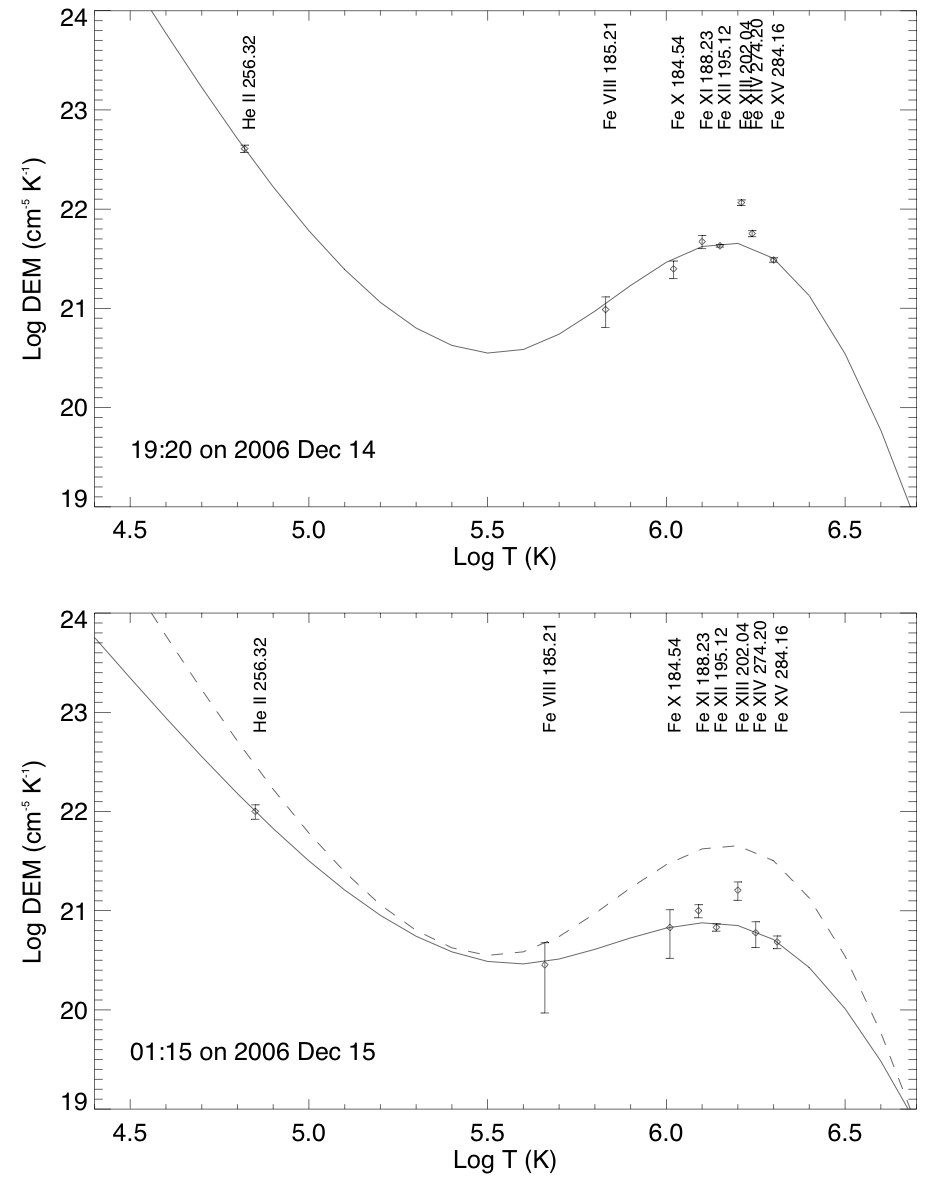
Figure 5: DEM curves before (upper) and during (lower) a dimming event. The DEM curve before the dimming is overplotted as the dashed line in the lower panel.
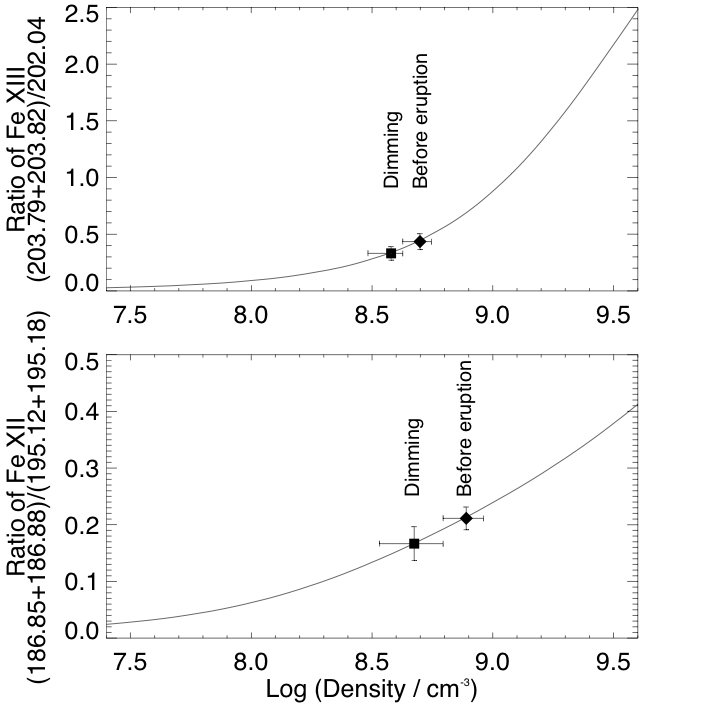
Figure 6: Electron density diagnostics before and during a dimming event.
Temperature-dependent outflows from the boundary of the dimming region:
Several temperature-dependent outflows have been found immediately outside the (deepest) dimming regions. An example is shown in Fig.7. The speed increases with temperature and reaches approx. 150 km/s at log (T/K) = 6.3. Interestingly, our RB asymmetry analysis is able to detect some of these temperature-dependent outflows (see details in Tian et al. 2012). These outflows are interpreted as evaporation flows, which are perhaps driven by enhanced thermal conduction or nonthermal electron beams along reconnecting field lines, or induced by the interaction between the opened field lines in the dimming region and the closed loops in the surrounding plage region.
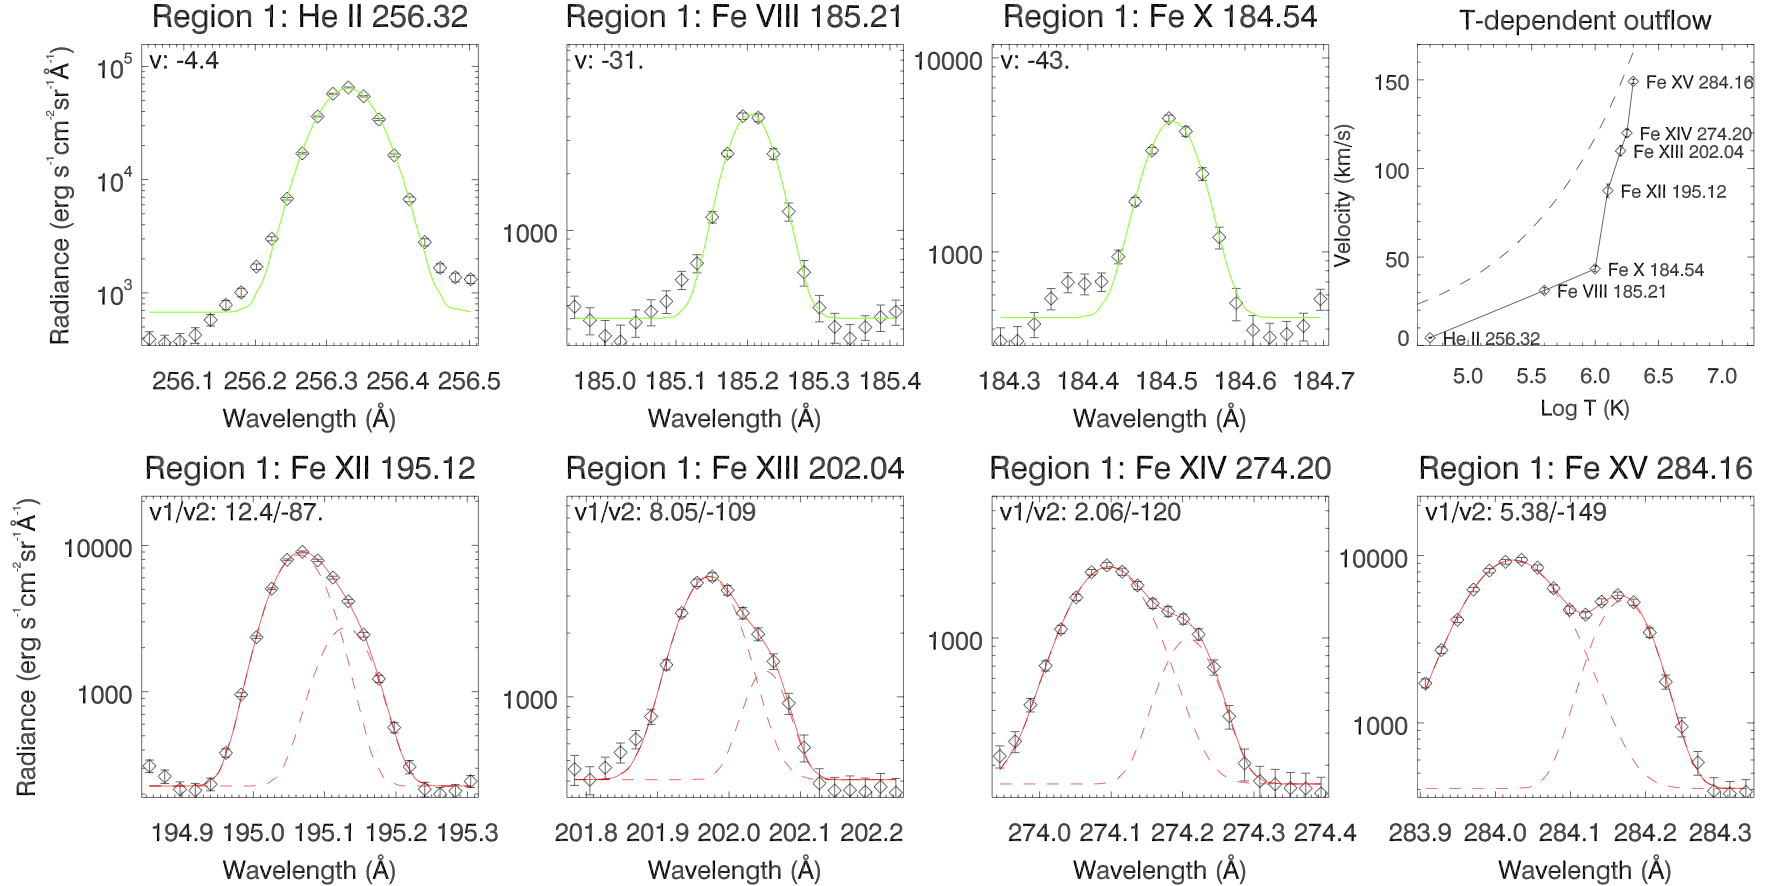
Figure 7: A temperature-dependent outflow identified immediately outside a dimming region. The velocities (v) derived from the single (SGF) and double (v1 and v2 for the two components) Gaussian fits are shown in each panel. Also shown is the temperature-dependent outflow velocity and the adiabatic sound speed (dashed curve in the upper right panel).
References
---------------
Tian, H., et al. 2012, ApJ, 748, 106
Jin, M., et al. 2009, ApJ, 702, 27
Harra, L. K., et al. 2007, PASJ, 59, S801


