Quasi - Periodic Fluctuations and Chromospheric Evaporation in a Solar Flare
by Jeffrey Brosius, Andrew Inglis, and Adrian Daw

Rapid cadence (11.2 s) EUV flare stare spectra such as those obtained with EIS
through IHOP 241 enable us to investigate the evolution of the flaring solar
atmosphere on timescales comparable to those on which the atmosphere evolves. Here
(see Brosius, Daw, & Inglis 2016) we present such EIS observations of a GOES M7.3
flare ribbon in AR 12036 on 2014 April 18, along with coordinated IRIS, RHESSI, and
Fermi/GBM observations. See Figure 1. We find quasi-periodic (P = 75.6 +/- 9.2 s)
intensity fluctuations in EUV emission lines of O IV, Mg VI, Mg VII, Si VII, Fe XIV,
and (although harder to detect) Fe XVI during the flare's impulsive rise. The
fluctuations ended when the maximum intensity in Fe XXIII line emission (which did
not show quasi-periodic intensity fluctuations) was reached.
Quasi-periodic fluctuations are intrinsic to solar flares, and have been observed in
flare light curves over a wide range of wavelengths. They are likely caused by time
variability in the charged-particle acceleration process, as would occur if magnetic
reconnection proceeded quasi-periodically (Nakariakov et al. 2006, 2010; Inglis &
Nakariakov 2009; Guidoni et al. 2016). It is challenging to ascribe a unique causal
mechanism to any given observation of quasi-periodic fluctuations.
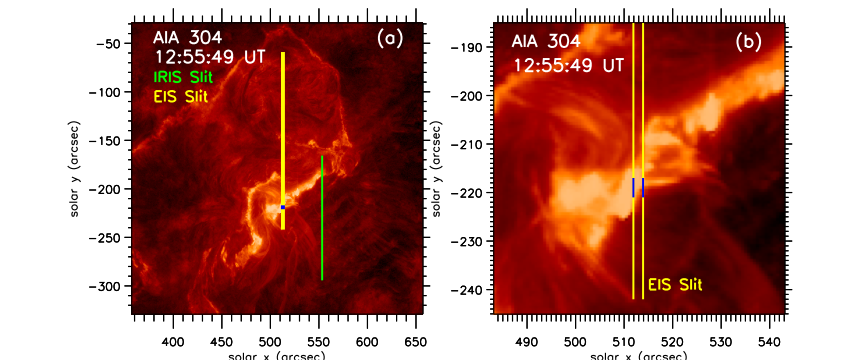
Figure 1:
AIA 304 A image showing the locations of the EIS and IRIS slits, both of which
tracked their targets. The flare started at 12:31 UT, and the EIS stare study began
at 12:39:38 UT. We analyze spectra averaged over slit y-pixels 21 through 24
(-221 arcsec to -217 arcsec in solar disk y-coordinates), highlighted in dark
blue. This corresponds to an area comparable to the spatial resolution of EIS.
Profiles of the O IV - Fe XVI lines (see Figure 2) reveal that they were all
redshifted during most of the interval of quasi-periodic intensity fluctuations,
while the Fe XXIII profile revealed multiple components including one or two highly
blueshifted ones. This indicates that the flare underwent explosive chromospheric
evaporation during its impulsive rise. See Figure 3.
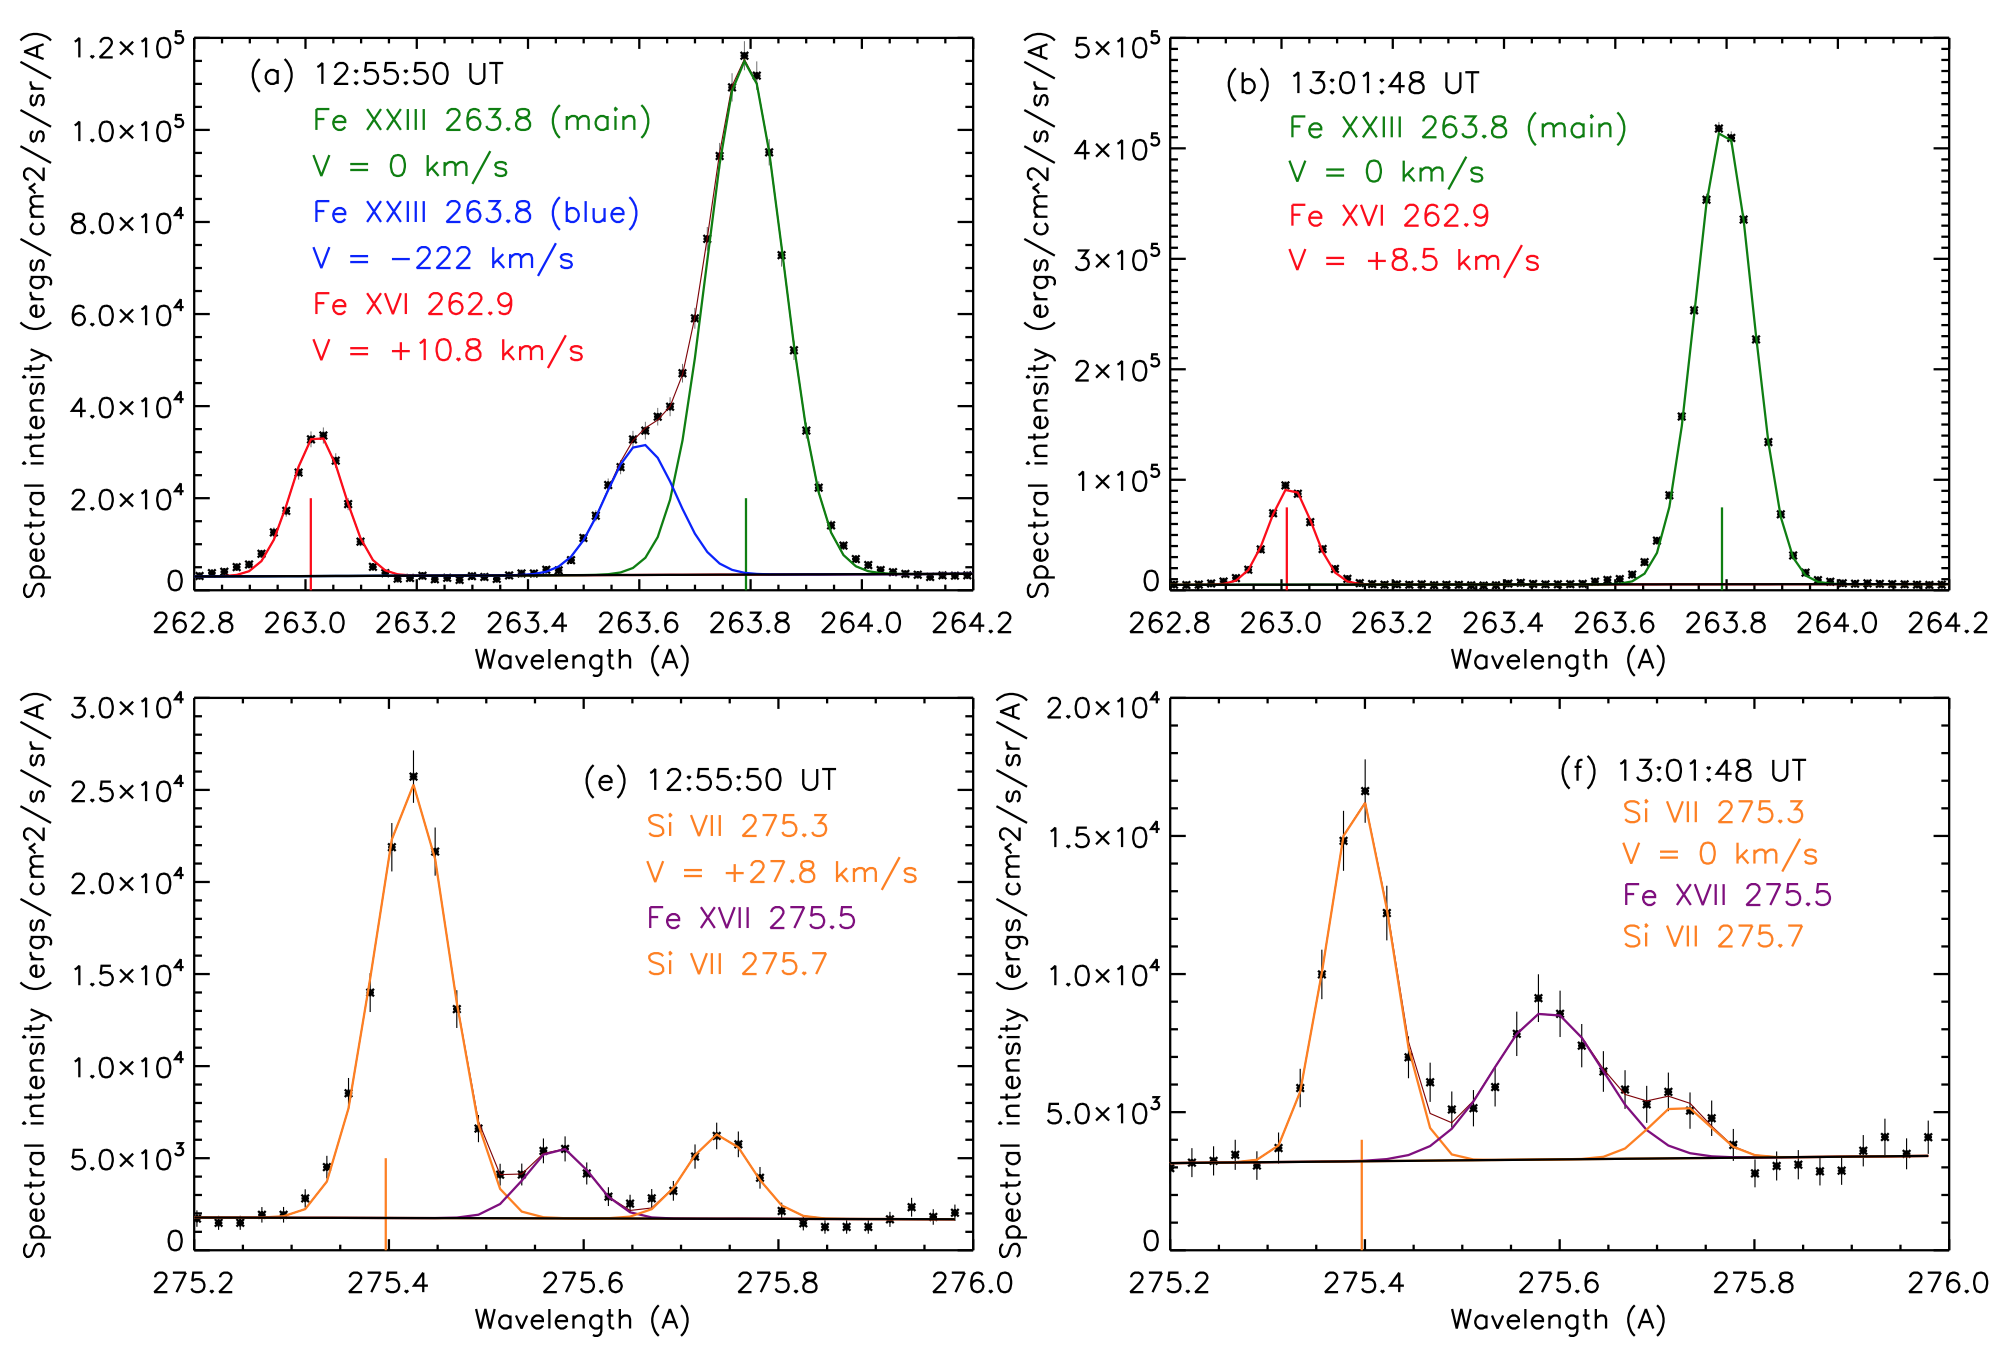
Figure 2: Frames (a) and (b) show sample profiles of Fe XVI 262.9 A and Fe XXIII 263.8 A
emission lines in averaged (over slit pixels 21-24) EIS spectra from the ribbon at
two different times during the flare. Frames (e) and (f) show Si VII 275.3 A (with
its Fe XVII and Si VII neighbors) at the same times. Color-coded vertical lines
indicate "reference" wavelengths against which relative Doppler velocities (given in
each frame) are derived. The overall fit is overplotted as a thin brown line, most
evident between the main and blueshifted Fe XXIII components in (a).
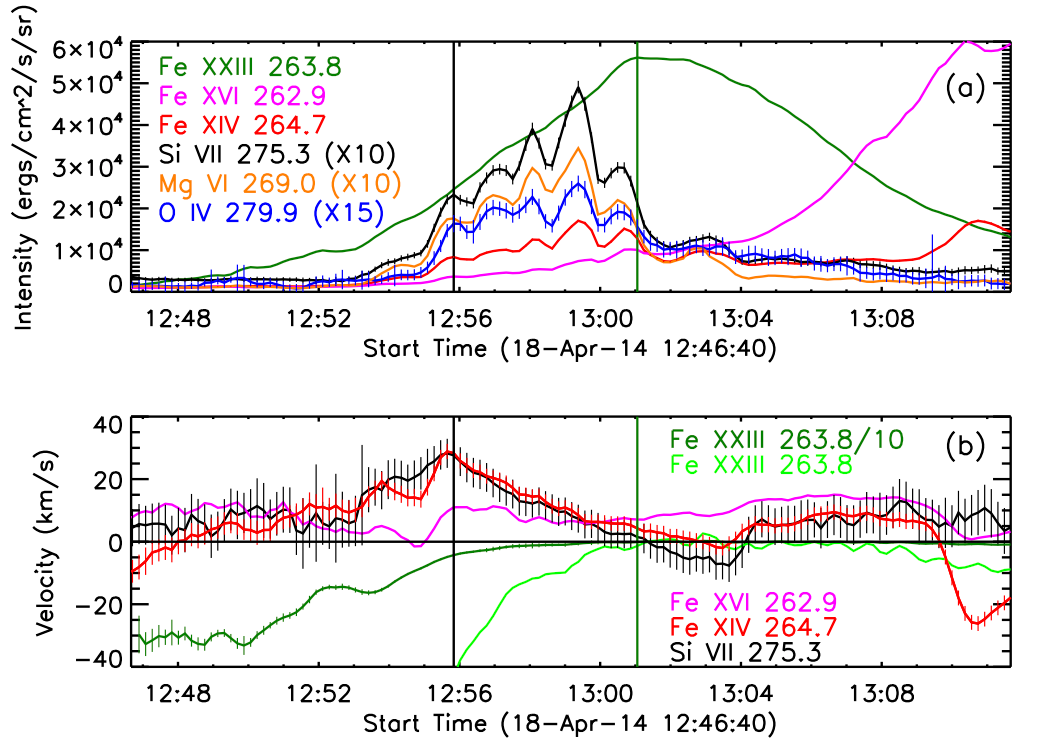
Figure 3: Light curves (a) and relative Doppler velocities (b) derived from EIS spectra of the
flare ribbon. Curves are color-coded as indicated, and some have been scaled to
enhance visibility; note that the Fe XXIII velocity is displayed on two different
scales to accommodate its wide range. Uncertainties are overplotted for the Si VII,
Fe XIV, and O IV intensities, and for the Si VII, Fe XIV, and Fe XXIII velocities;
in some cases (especially the Fe XIV intensities) the uncertainties are smaller than
the thickness of the curve. The vertical black line indicates the second in the
series of six quasi-periodic intensity peaks in the EIS light curves (12:55:46+/-06
UT); the vertical green line indicates the time of maximum Fe XXIII 263.8 A
intensity (13:01:03 UT) observed by EIS in the ribbon.
Based on the EIS observations alone, we conclude that the series of quasi-periodic
intensity peaks in the EUV light curves was produced by a series of energy
injections into the chromosphere, likely by nonthermal electrons. Significant
redshifts and blueshifts ended near the time of maximum Fe XXIII intensity,
indicating the end of chromospheric evaporation during the impulsive phase; the
exception to this is Fe XVI, whose persistent redshift we interpret to indicate the
presence of warm rain (flare-heated plasma that is cooling and falling).
Fluctuations in the relative Doppler velocities were detected, but their
signal-to-noise ratios were inadequate to extract significant quasi-periodicities.
RHESSI detected 25-100 keV hard X-ray (footpoint) sources in the ribbon near the EIS
slit's pointing position during the peaks in the EIS intensity fluctuations. See
Figure 4. This is consistent with a series of energy injections into the
chromosphere by nonthermal particle beams, sufficient to drive the observed
explosive chromospheric evaporation.
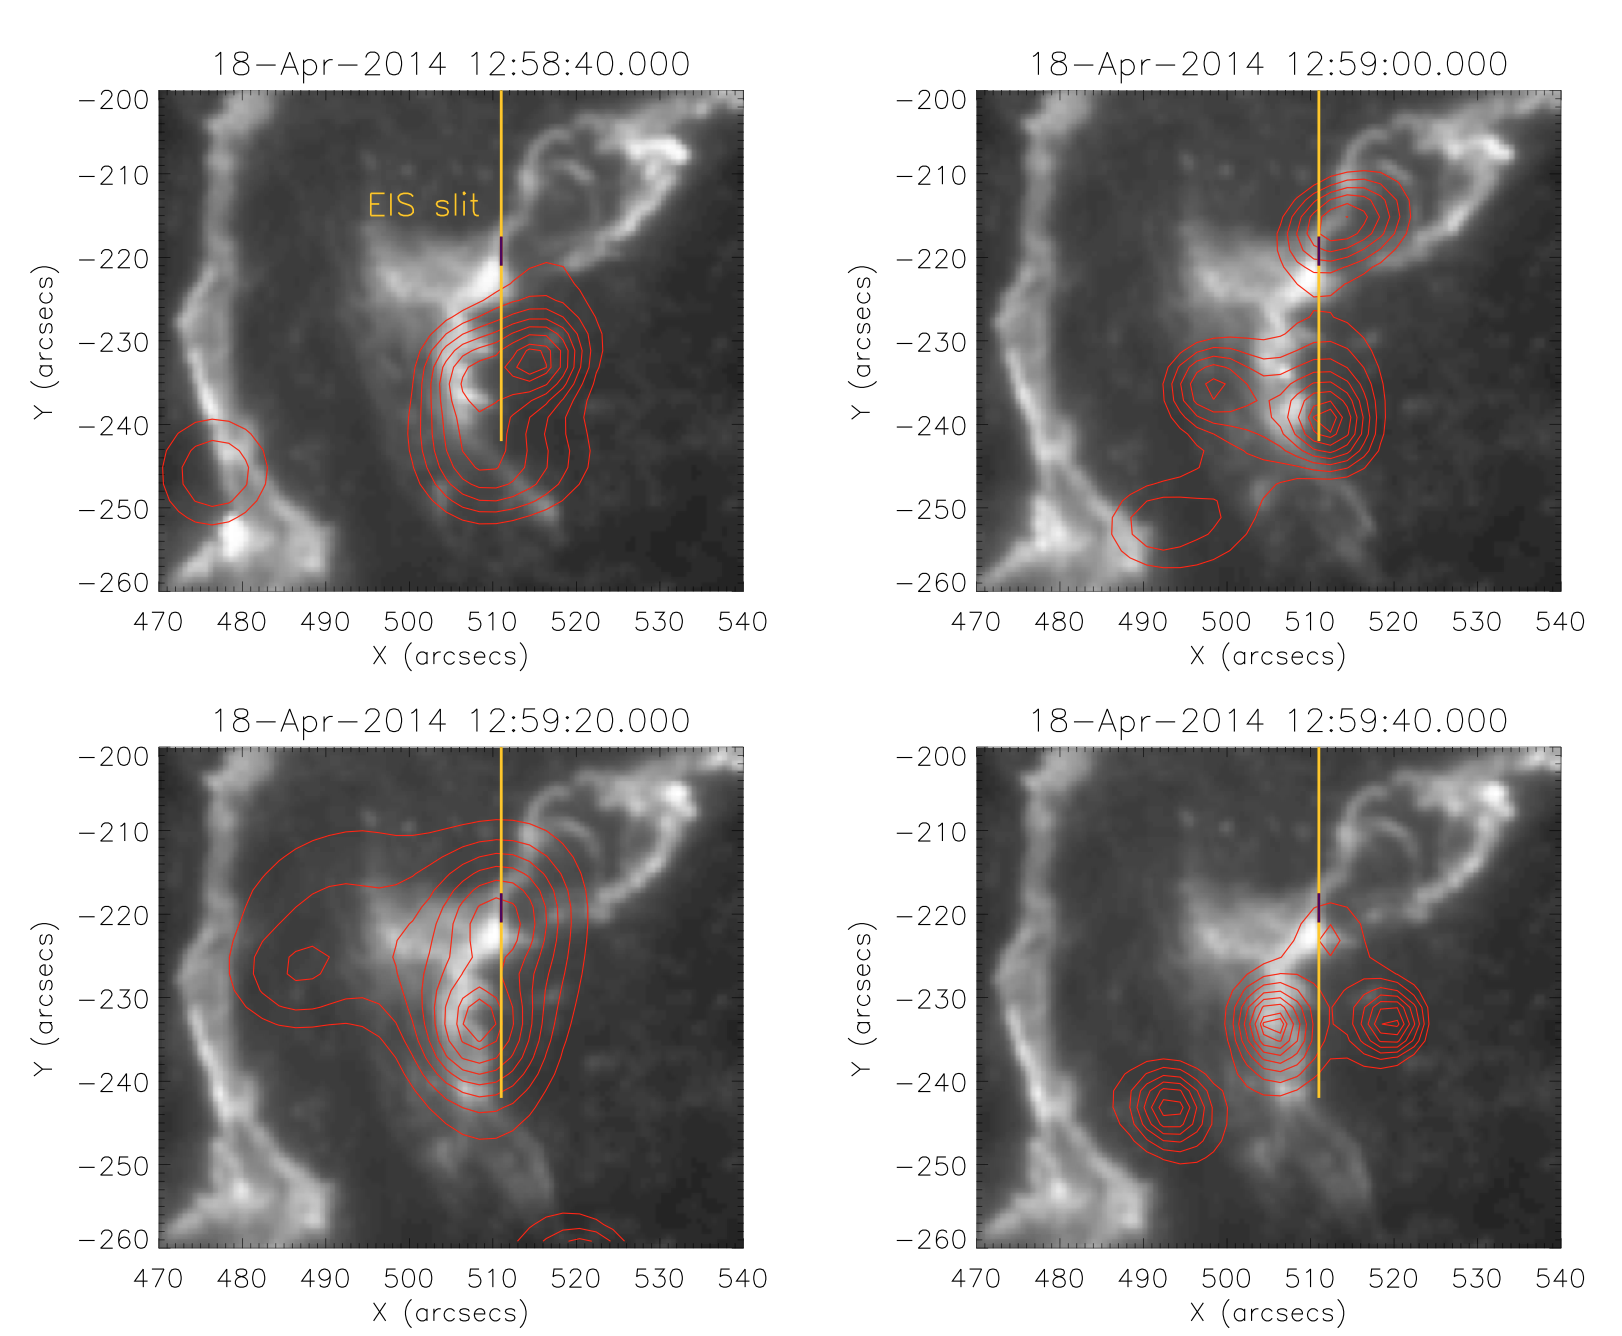
Figure 4: Evolution of the 25-100 keV emission observed by RHESSI around the time of the
largest EUV intensity peak (12:59:20+/-04 UT) in the Figure 3 light curves,
displayed as contours atop co-temporal AIA 1600 A images. Contour levels are 30,
40, 50, 60, 70, 80, 90 and 95% of the maximum flux within each frame. The EIS slit
position is shown by the vertical yellow line, in which the dark blue segment
(-221 arcsec to -217 arcsec) is the same as shown in Figure 1. Note that the RHESSI
contour centroids are far from the dark blue segment in the first and last frames in
this series, and that they are near it in the middle two frames (12:59:00 and
12:59:20 UT).
Electron densities derived with Fe XIV (4.6 X 10^10 /cm^3) and Mg VII (7.8 X 10^9
/cm^3) average line intensity ratios during the interval of quasi-periodic
intensity fluctuations, combined with the radiative loss function of an optically
thin plasma, yield radiative cooling times of 32 s at 2.0 MK, and 46 s at 0.63 MK;
assuming the same density for Fe XXIII that we derived for Fe XIV yields a radiative
cooling time of 1000 s at 14 MK. We speculate that fluctuations are observed in the
lower temperature (but not Fe XXIII) lines because at those temperatures the plasma
had sufficient time to radiatively cool between successive energy injections.
Quasi-periodic fluctuations were also observed in IRIS light curves (Brosius & Daw
2015) from the same ribbon at the same time they were observed in EIS light curves,
but from a location about 40 arcsec west of the EIS slit (see Figure 1). The
cadence of the IRIS stare spectra was 9.4 s. Light curves of O IV 1401.2, Si IV
1402.8, and C I 1355.8 A reveal 7 intensity peaks, the first 4 of which yield a
quasi-period of 173.2 +/- 23.5 s, while the last 4 yield 94.4 +/- 4.9 s. Only one
intensity peak observed by EIS, at 12:55:46+/-06 UT, was cotemporal with an
intensity peak observed by IRIS, at 12:55:43+/-03 UT; none of the others were
simultaneous within their timing uncertainties. With its limited dynamic range,
RHESSI detected no hard X-ray emission from the ribbon at the location of the IRIS
slit. The GBM 25-50 keV light curve shows fluctuations in which its four greatest
peaks appear to be quasi-periodic (P = 72.7 +/- 2.7 s). The second GBM peak, its
largest, is cotemporal with the first peak in the EIS light curves (12:54:21+/-13
UT). Overall, the timing of the full Sun, spatially unresolved flare emission is
different than that in the small spatial areas of the ribbon observed by the EIS
and IRIS slits.
REFERENCES
----------------------
Brosius, J.W., & Daw, A.N. 2015, ApJ, 810, 45.
Brosius, J.W., Daw, A.N., & Inglis, A.R. 2016, ApJ, 830, 101.
Guidoni, S.E., DeVore, C.R., Karpen, J.T., & Lynch, B.J. 2016, ApJ, 820, 60.
Inglis, A.R., & Nakariakov, V.M. 2009, A&A, 493, 259.
Nakariakov, V.M., Foullon, C., Verwichte, E., & Young, N.P. 2006, A&A, 452, 343.
Nakariakov, V.M., Inglis, A.R., Zimovets, I.V., Foullon, C., Verwichte, E.,
Sych, R., & Myagkova, I.N. 2010, PPCF, 52, 124009.
Next EIS Nugget »» coming soon...
TBC
Last Revised: 27-Oct-2011
Feedback and comments: webmaster
|


