Measuring solar flare non-Gaussian velocities using EIS spectroscopy
Natasha Jeffrey, Lyndsay Fletcher, Nicolas Labrosse

In a solar flare, a large fraction of the magnetic energy released is converted rapidly to kinetic energy. This produces non-equilibrium particle distributions and turbulent plasma conditions. We analyse Hinode EIS data and study non-Gaussian line profiles to look for evidence of non-equilibrium ion velocities in a solar flare. We study the profiles of high-temperature optically thin EUV emission lines of Fe XVI (262.976 angstrom, 3 MK) and Fe XXIII (263.760 angstrom, 15 MK) from a major X1.0 flare SOL2014-03-29T17:44. We also account for the possibility that non-Gaussian lines might be an EIS instrumental effect. The results suggest the possibility of a new diagnostic tool for solar flare-accelerated ions or solar flare turbulent plasma motions (Fig. 1).
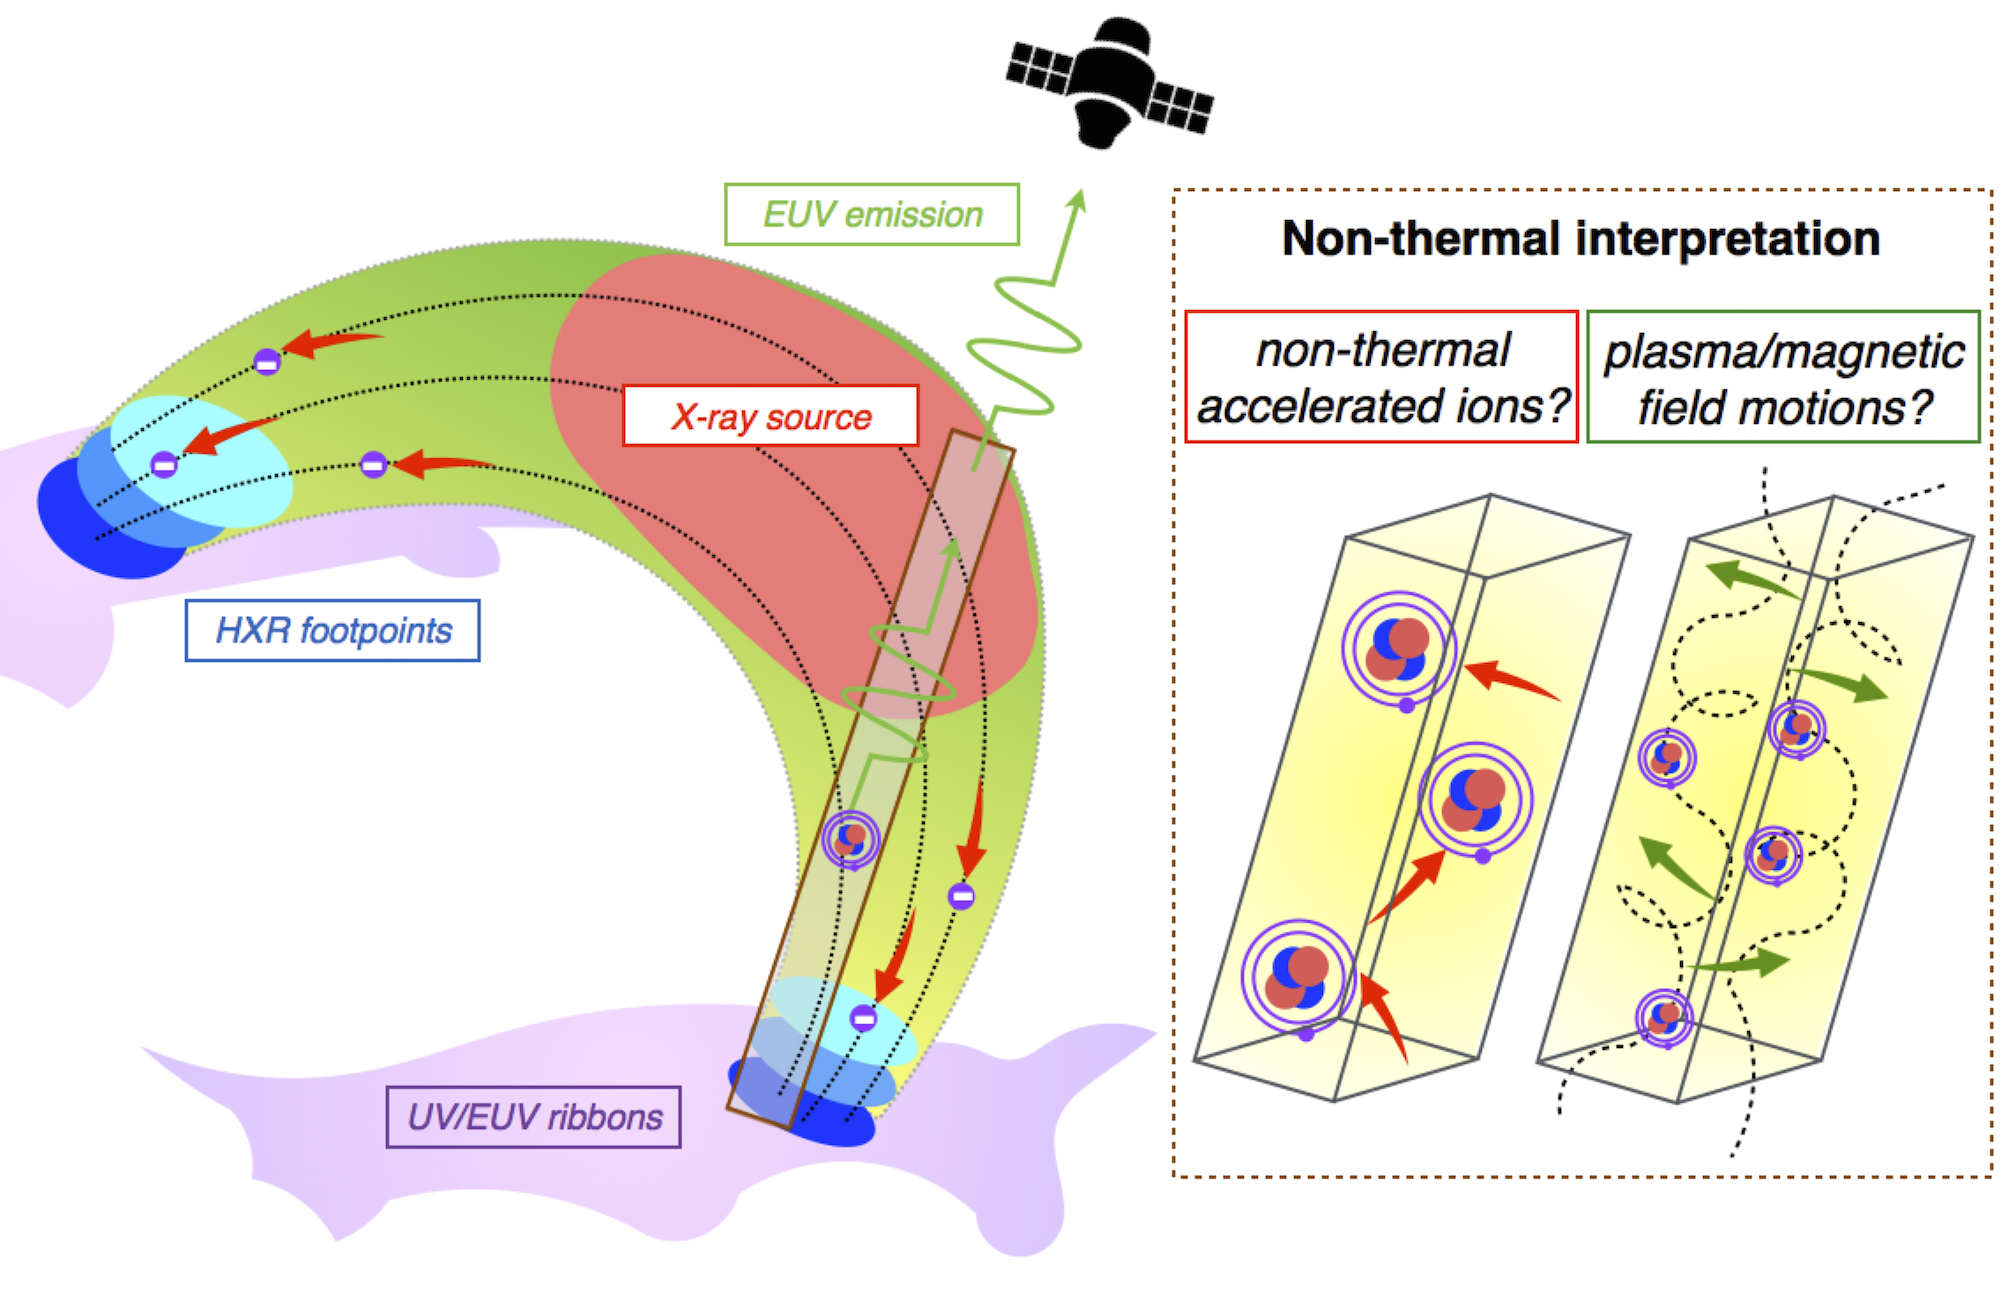
Figure 1: Solar flare non-Gaussian EUV spectral lines could be due to flare-accelerated ions or turbulent plasma motions.
Detecting solar flare non-Gaussian spectral line profiles
Gaussian fitting to spectral lines allows us to infer the distribution moments (intensity, centroid etc.) providing information about e.g. abundances and densities, but new diagnostics can come from studying the shape of the line profile in detail. If the spectral line shape is non-Gaussian, then we can characterise its non-Gaussianity by fitting the line with a more general kappa line profile. Kappa line profiles better reproduce the shapes of lines that are more peaked and with heavier tails than a Gaussian. Unblended Fe XVI and Fe XXIII lines are fitted with a kappa line profile convolved with a Gaussian line profile (W) that automatically accounts for (1) a physical non-Gaussian profile (K) as well as (2) a Gaussian instrumental profile (G),

for wavelength λ. We are interested in fit parameters A[3] = σK, a characteristic width and A[4] = κ, the kappa index, of the non-Gaussian kappa distribution, that can describe any non-Gaussianity. The physical line profile tends to a Gaussian as A[4] = κ goes to infinity (or ~ 20 for real data!).
We find that in many locations the line profiles are indeed non-Gaussian, and more consistent with a kappa-distribution of emitting ion velocities (Fig. 2). The analysis finds that, at the flare footpoints, close to sites of hard X-ray emission from non-thermal electrons, the kappa-index for Fe XVI takes low values of 3-5. In the corona, close to a low-energy hard X-ray source, Fe XXIII also shows low kappa values of typically 4-7. The non-Gaussian properties vary in space and time and the full results can be found in Jeffrey, Fletcher & Labrosse (2017).
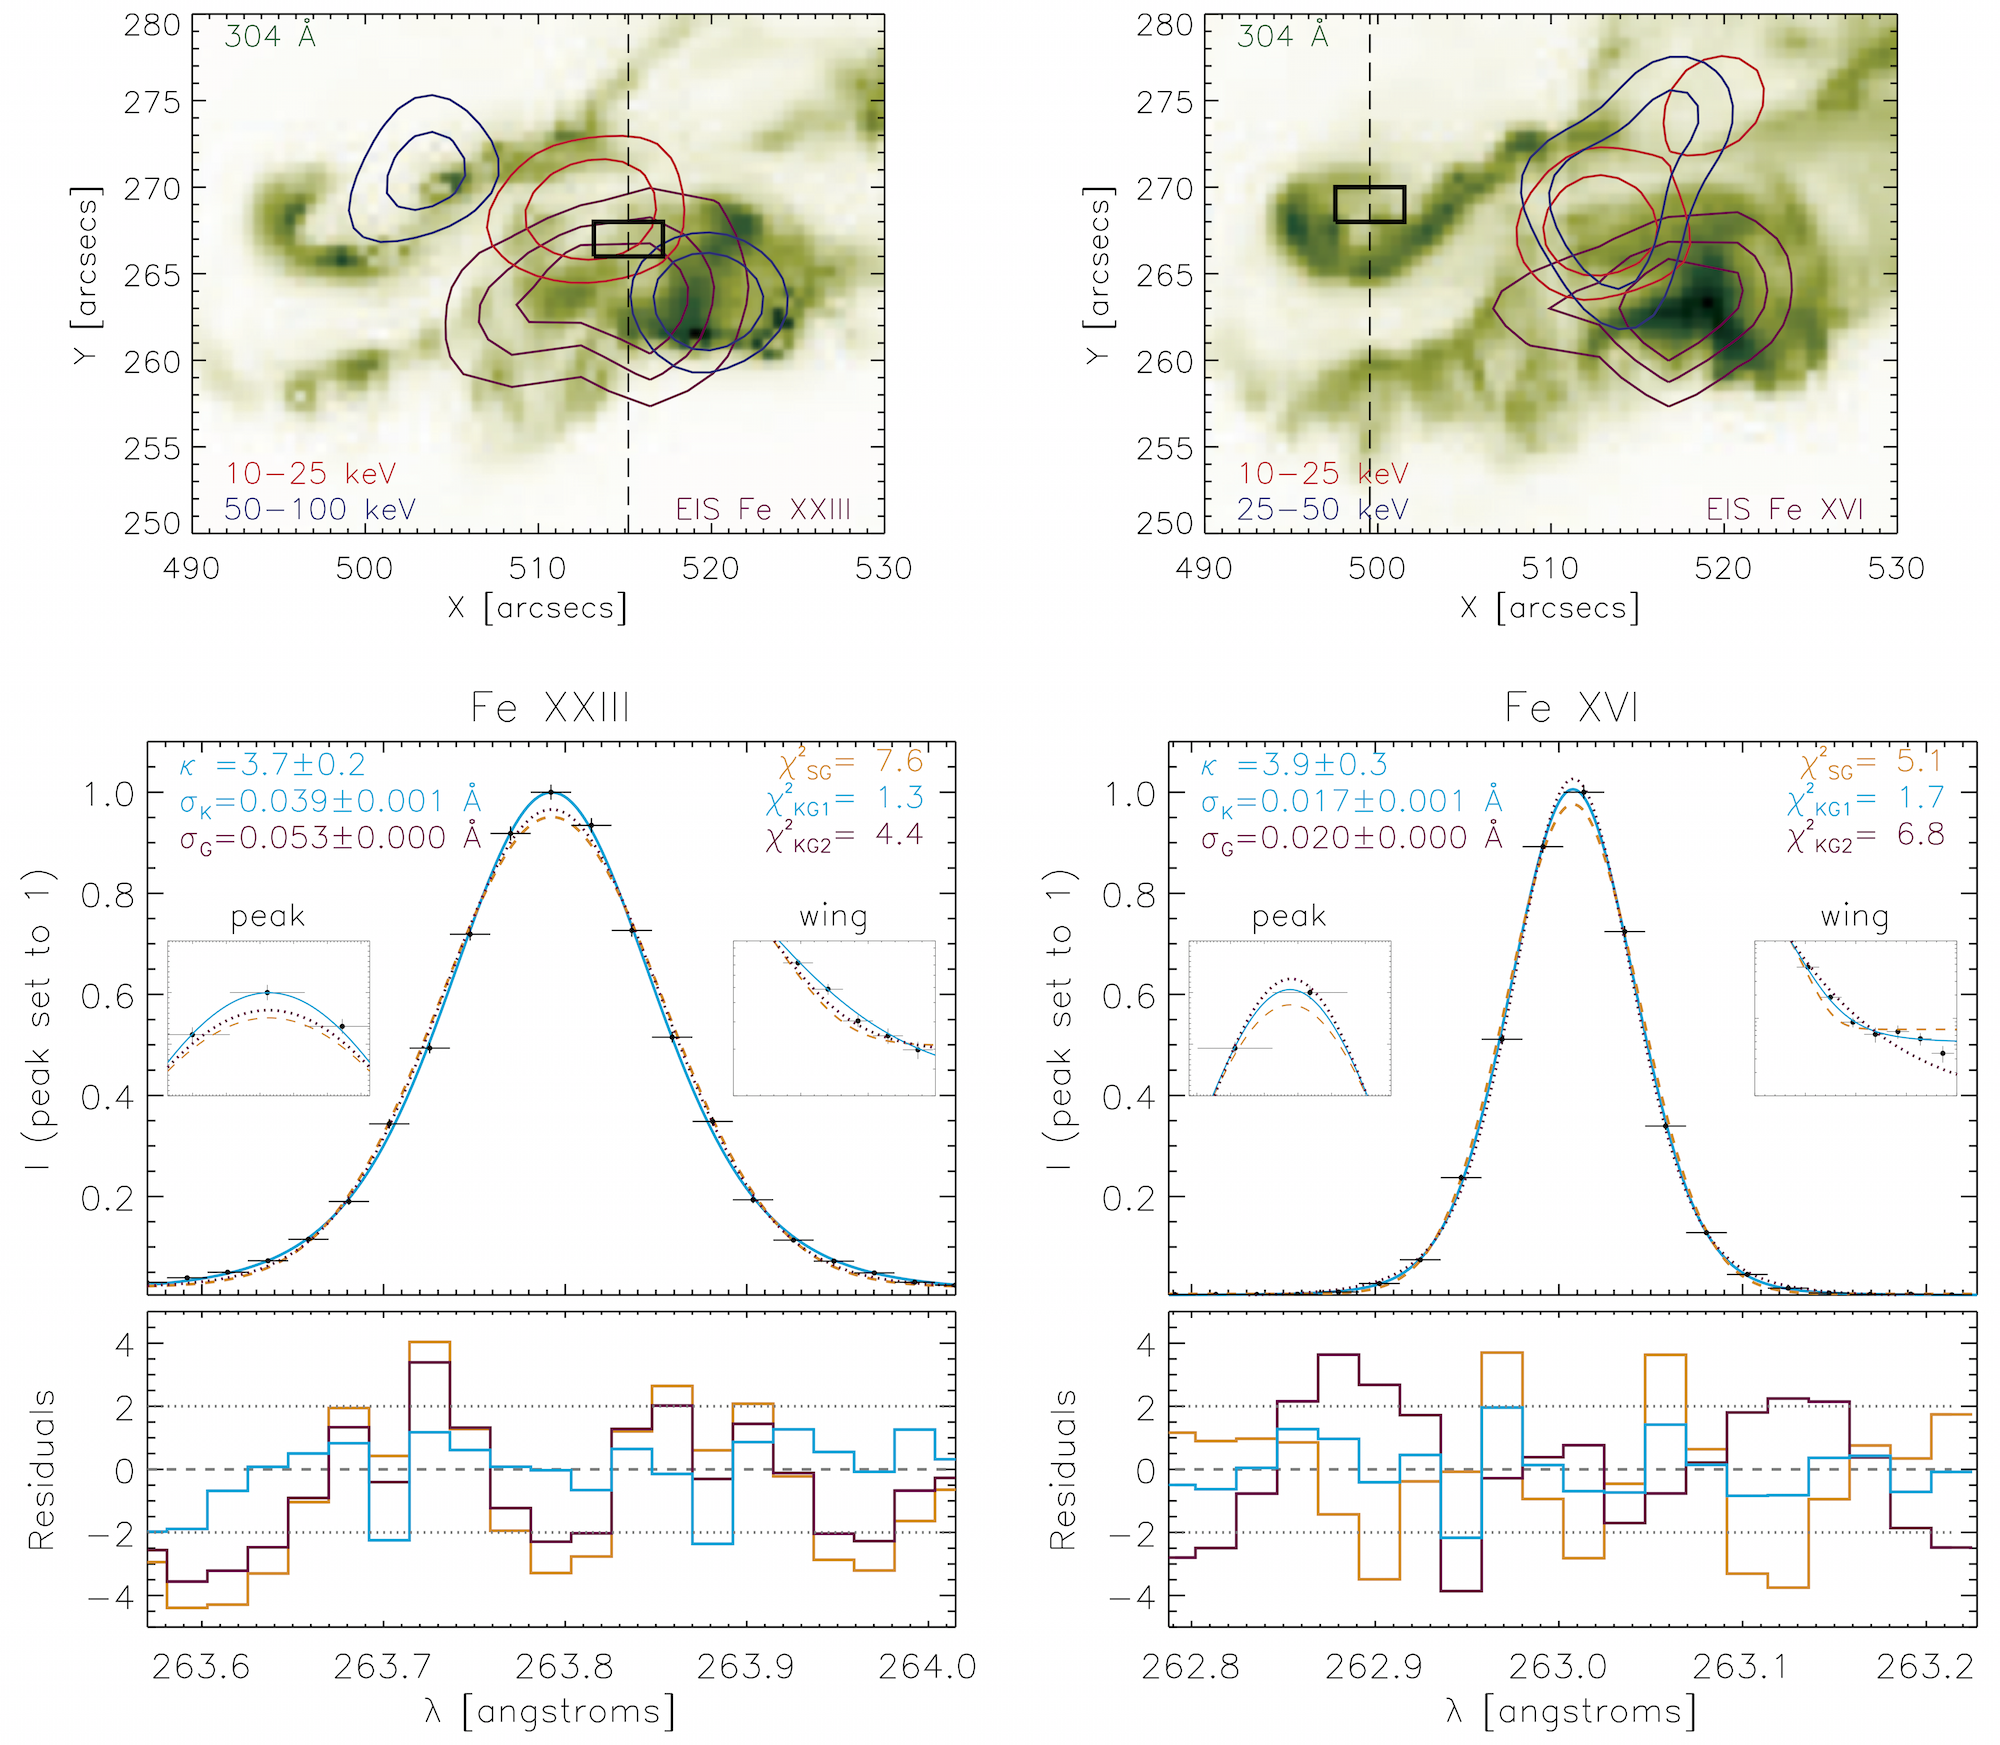
Figure 2: Fe XVI and Fe XXIII lines in two different regions of the flare at two times close to the peaks of hard and soft X-rays. Each line is best described by a non-Gaussian kappa line profile. Top images: Background image = SDO AIA 304 A, RHESSI contours at 10-25 keV (red) and 25-50 or 50-100 keV (blue) and EIS Fe XVI or Fe XXIII (purple). Bottom: Here we show two cases where a kappa line profile (blue) fits the observed lines better than a Gaussian (orange).
An instrumental cause?
Importantly, we test whether the instrumental profile can produce the observed kappa line profiles, which frustratingly, is difficult to rule out completely. However, if the instrumental profile has a non-Gaussian kappa shape, then all of the observed lines should have the same fixed kappa index (A[4] = κ) and width parameter (A[3] = σK). Further, we tested two model lines with a chosen (fixed) kappa instrumental profile convolved with a Gaussian of varying width representing a physical line profile, and fitted with Equation [1] (Fig. 3). Observed line values fitted with Equation [1] are plotted and compared. The observed parameters show different values of kappa for a given width (σK) and vice-versa. This is suggestive (but not conclusive) that the cause of the observed non-Gaussian profiles is physical. The observed trends in the kappa parameter show that we are most likely detecting the properties of the ion population rather than any instrumental effects.
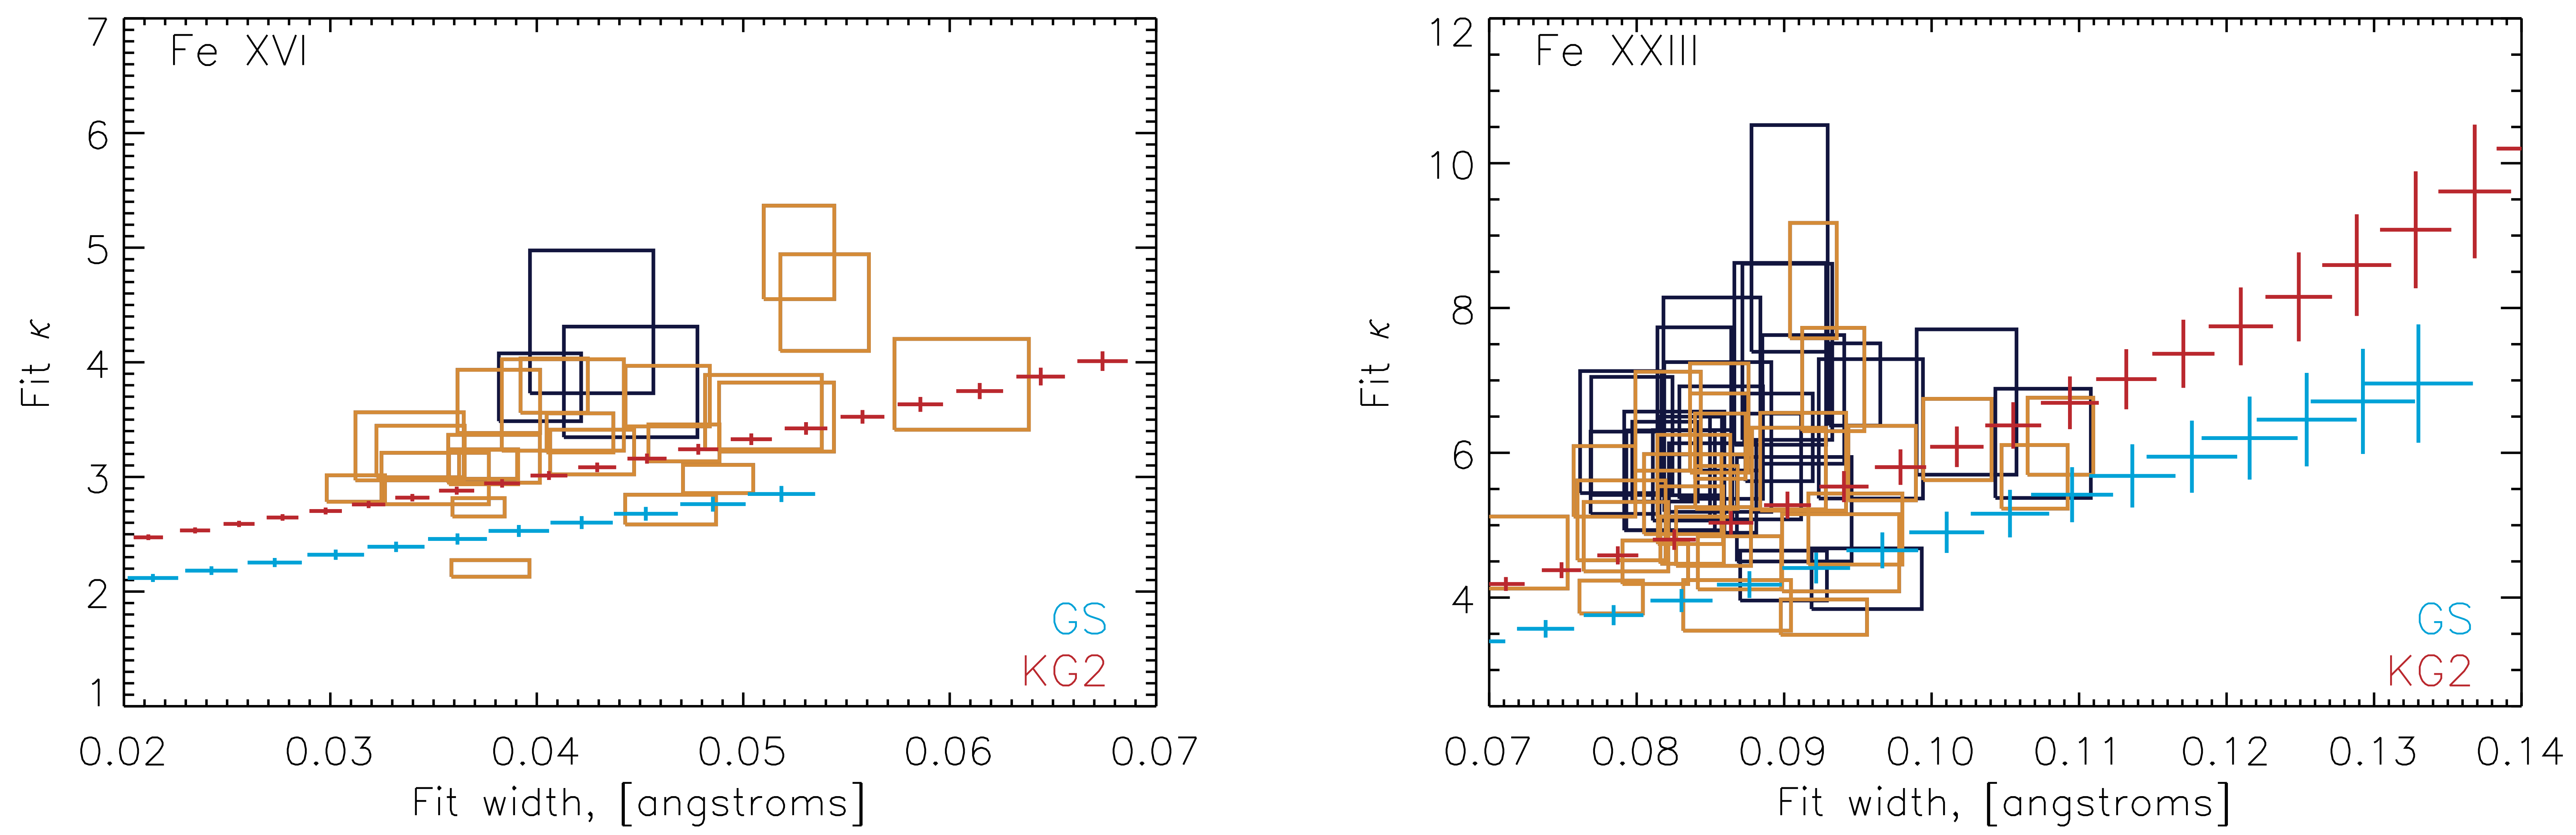
Figure 3: Two model lines with different non-Gaussian instrumental profiles are convolved with a Gaussian of varying width and each is fitted with Equation [1] and the resulting fitted kappa index (A[4]) versus width (from A[3]) is plotted. Rectangles depict observed values and errors.
This analysis pushes the limits of EIS. We are as certain as we can be that the non-Gaussian profile is not instrumental, however it cannot be dismissed completely for EIS. We suggest that the instrumental profile of future EUV spectrometers is measured precisely well into the line wings, so that higher moments of the line shape can be found with confidence in future solar observations.
A physical interpretation
Non-thermal ion motions
One interpretation is that the kappa-line shapes are due to the Doppler motions of flare-accelerated non-thermal ions. Such an observation would prove to be useful since we have very little information about lower energy ions below MeV energies. We tested this by examining ion Coulomb collisions in a solar flare plasma with number densities 1010 cm-3. The highest ion velocities we can detect via EUV spectroscopy are 200-300 km/s and low energy ions (<MeV) are dominated by ion-proton interactions with a high rate of energy loss per collision. We found that it is possible to have flare-accelerated ions but interestingly the ions need to be locally accelerated where the EUV emission originates, throughout the observed time of the flare, and on a timescale of 0.1 s or less to overcome the effects of collisions.
Plasma turbulence
Another interpretation for the non-Gaussian line shapes is plasma motions and the presence of plasma turbulence from magnetic fluctuations. Many solar flare EUV lines show the presence of plasma turbulence through excess line broadening which is assumed to produce a Gaussian line profile with a width greater than the isothermal width. If stochastic turbulence produces larger and more sporadic particle motions than that of Brownian motion, then the resulting velocity distribution could be non-Gaussian. From observation, the presence of bulk flows is backed-up by small relative redshifts observed in all lines which is suggestive of an overall macroscopic sunward flow. The detection of solar flare non-Gaussian turbulence would be an observational first.
Conclusions and implications for future solar flare modelling
The detection of solar flare non-Gaussian EUV spectral lines from Hinode EIS data is an interesting result. At the very least, this work highlights the need for better characterisation of the instrumental profile so that new diagnostic techniques may be used in spectroscopic observations with future missions. Our analysis shows that non-Gaussian plasma turbulence is the more plausible explanation. However, we cannot completely rule out the presence of flare-accelerated ions and this will be further investigated by modelling. Both options open new and exciting diagnostic tools for solar flare physics and have implications for solar flare modelling. Importantly, this is the second large flare where non-Gaussian velocities have been found (see Jeffrey, Fletcher & Labrosse (2016)).
Authors: Natasha Jeffrey, Lyndsay Fletcher and Nicolas Labrosse (University of Glasgow, UK).
References: [1] Jeffrey, Fletcher & Labrosse 2017, [2] Jeffrey, Fletcher & Labrosse 2016.
Next EIS Nugget »» coming soon...
TBC
Last Revised: 27-Oct-2011
Feedback and comments: webmaster
|


