In order to understand the mechanisms that trigger and drive solar flares, as well as
the processes that occur during flares, we need spectroscopic observations at
cadences comparable to the timescales on which flares evolve. IHOP 241 was designed
with this goal in mind. Here we present results from coordinated, rapid cadence IRIS
and EIS stare spectra of a GOES C3.1 flare in AR 12002 (S21 W14) obtained through
IHOP 241 on 2014 March 15, along with coordinated hard X-ray observations from
RHESSI. We find that flare emission in chromospheric and transition region lines
showed an earlier start than did emission from plasma at "flare temperatures" (~10
MK), and that explosively evaporated material observed by IRIS fell as warm rain
and accumulated in a separate area observed by EIS. For a more complete description
of the observations, analysis, results, and conclusions see Brosius & Inglis (2017).
In GOES soft X-rays, the flare started at 00:21:35 and peaked at 00:26:30 UT. The
IRIS slit was pointed nicely within the flare, and the EIS slit, deliberately offset
35 arcsec west of the IRIS slit, observed areas remote from the flare. See Figures
1 & 2.
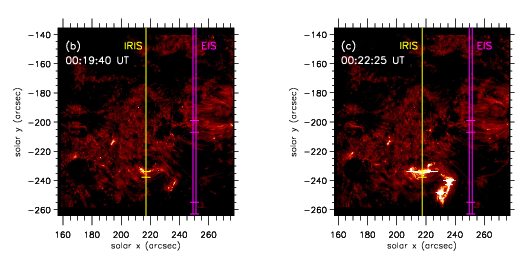
Figure 1: IRIS 1400 Å slit-jaw images at two different times during the flare, with the IRIS
and EIS slits overplotted. The horizontal yellow lines across the IRIS slit indicate
the 4-arcsec segment in which the Fe XXI 1354.1 Å line intensity became brightest
during the flare, and the horizontal lines across the EIS slit indicate the two
8-arcsec segments in which weak activity became evident. Images and spectra show
that flare activity began at the location of the IRIS slit several minutes before
the 00:21:35 UT start of the flare in GOES observations.
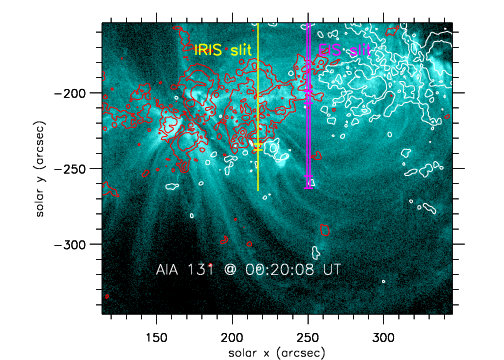
Figure 2: Image from AIA's 131 Å channel at 00:20:08 UT, after the flare was observed to begin
in IRIS slit spectra (00:16:56 UT) but before the start of the flare observed in the
GOES soft X-ray light curves (00:21:35 UT). IRIS and EIS slits are overplotted as
labeled, and the horizontal lines have the same meaning as in Figure 1. Contours of
the HMI line-of-sight magnetogram obtained at 00:19:14 UT are overplotted, where red
indicates inward-directed fields of -100 and -500 G, and white indicates
outward-directed fields of +100 and +500 G.
With IRIS spectra, we focus on the time evolution of intensities and relative Doppler
velocities in emission lines of C II 1334.5, C II 1335.7, Si IV 1402.8, and Fe XXI
1354.1Å. The exposure duration was 15 s for each of the 1000 IRIS stare spectral
exposures, and the average cadence was 16.5 s. In order to reduce the noise, for
every exposure we averaged the spectra into 1-arcsec segments, that is, we averaged
over six slit spatial pixels (subsequently identified with a YPIX6 number). We
obtained pre-flare reference wavelengths for C II and Si IV (and, indirectly, for
Fe XXI) by averaging spectra from 130 exposures before the flare over a 27-arcsec
segment of the IRIS slit in the active region. Because the C I wavelength in the
pre-flare averaged spectrum does not differ significantly from its 1354.288 Å rest
wavelength (Kelly 1987), we adopt the rest wavelength of Fe XXI (1354.0714 +/- 0.0108
Å) derived by Brosius & Daw (2015) as its reference wavelength. Because the C II and
Si IV line profiles became complex during the flare (as well as at other times), and
do not conform to a single Gaussian shape, we fit the profiles of these three lines
with three Gaussians each. Figure 3 shows sample line profiles during the flare.

Figure 3: Sample line profiles of Fe XXI and Si IV at 00:25:43 UT, averaged over a 1-arcsec
segment of the IRIS slit within the flare. The reference wavelengths are given in
each frame and plotted as long vertical lines toward the bottom. The Fe XXI line is
blueshifted, with a relative Doppler velocity of -42.5 +/- 4.1 km s-1, while C I is not
significantly redshifted with a velocity of +5.5 +/- 6.4 km s-1 . The Si IV profile's redshift corresponds to +30.5 +/- 6.3 km -1, and the simultaneous, redshifted C II profiles at 1334.5 and 1335.7 Å yield
velocities of +32.1 +/- 3.6 km s-1 and +35.4 +/- 4.3 km s-1. The combination of
redshifted low-temperature emission and blueshifted Fe XXI emission indicates that
this flare underwent explosive chromospheric evaporation. Single Gaussian profile
fits were applied to the weak blending lines of Fe II and Si II near Fe XXI (e.g., Young et al.
2015, Brosius & Daw 2015), with the overall fit to all lines in the spectrum plotted
in red.
About 4 minutes before the start of the flare was observed by GOES, the C II and Si
IV line intensities observed by IRIS became (and remained) significantly greater than
their pre-flare average values; this indicates that the flare had begun and that the
chromosphere and transition region were involved. IRIS first detected significant,
blueshifted Fe XXI emission at 00:22:42 UT, by which time the C II and Si IV line
intensities had increased by factors around 100 and their profiles were significantly
redshifted. This combination of simultaneous, cospatial blueshifted Fe XXI emission
with redshifted C II and Si IV emission indicates explosive chromospheric
evaporation. See Figure 4.
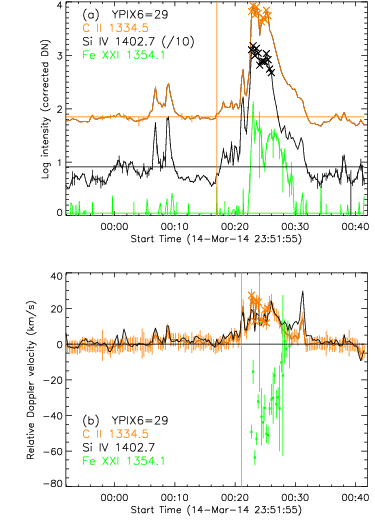
Figure 4: Light curves and relative Doppler velocities derived with IRIS spectra in a 1-arcsec
segment of the IRIS slit (YPIX6=29). Curves are color-coded as indicated, and the Si
IV intensity is reduced by a factor of 10 to enhance visibility. Uncertainties are
overplotted for all but the Si IV velocity, where we avoid doing so to enhance
visibility. The overplotted X's indicate measurements derived from spectra affected
by saturated spectral pixels; for the sake of clarity we avoided overplotting the X's
associated with the Si IV velocity measurements. The horizontal color-coded lines in
frame (a) indicate the pre-flare quiescent average intensities plus their associated
1-sigma scatters. The vertical orange line in frame (a) indicates the 00:16:56 UT
time of the first exposure (391) at which the C II line intensities continuously
significantly exceeded their pre-flare quiescent averages. We interpret this to be
the start of the flare at this location along the IRIS slit. The vertical orange
line in frame (b) indicates the 00:21:03 UT time of the first exposure (406) after
which the C II and Si IV lines exhibited continuous significant redshift during the
flare. We infer gentle evaporation from 00:16:56 to 00:21:03 UT, followed by
explosive evaporation once C II and Si IV were redshifted, and certainly by the time
Fe XXI was observed and blueshifted (00:22:42 UT).
EUV spectra were obtained with the EIS study FLAREDOP_EIS, for which a detailed
description is given by Brosius, Daw, & Inglis (2016). EIS began observing at
23:50:06 UT on 2014 March 14, and tracked the target until its observing run ended at
00:45:45 UT on 2014 March 15. The exposure duration was 10 s for each of the 300 EIS
stare spectral exposures, and the average cadence was 11.2 s. In order to reduce the
noise, for every exposure we averaged the spectra into 4-arcsec segments, that is, we
averaged over four slit spatial pixels (subsequently identified with a YPIX4 number).
We corrected for the well-known drift in the EIS wavelength scale using the procedure
described by Kamio et al. (2010, 2011). With EIS spectra, we focus on the time
evolution of intensities and relative Doppler velocities in emission of Fe XVI at
262.9, Fe XXIII at 263.8, Fe XIV at 264.8 and 274.2, and Si VII at 275.4 Å. EIS,
like IRIS, contains no absolute wavelength scale, so flare velocity measurements
derived with EIS spectra must be done relative to times and/or locations outside and
away from flares. Here we obtain reference wavelengths for the above lines from
exposures obtained between 00:00:09 and 00:18:02 UT on 2014 March 15 within the
southernmost 64-arcsec segment of the slit. Unfortunately, at the location of the
EIS slit, Fe XXIII emission is so weak and short-lived that no reference wavelength
can be measured, so no reliable relative Doppler velocities can be derived.
At the location of the EIS slit, in a localized area of enhanced magnetic field
strength seen in the HMI magnetogram that appears to be connected to the flare site
by faint loops evident in AIA 131 Å emission (see Figure 2), EIS spectra reveal Fe
XXIII emission that is too weak to measure velocities; intensity enhancements by
factors up to about 1.7 in the Fe XIV and Fe XVI line emission are observed at this
location. Lines from both of these coronal ions show redshifts about 9 km s
-1 around
00:24:00 UT. See Figure 5.
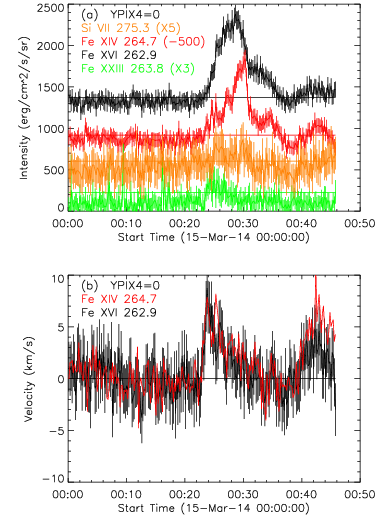
Figure 5: Flare light curves (a) and relative Doppler velocities (b) derived from EIS spectra
in YPIX4 = 0. Curves are color-coded as indicated, and some have been scaled or
shifted to enhance visibility. In frame (a), the Fe XVI brightening starts at
00:23:59 UT, Fe XIV at 00:23:37 UT, and Fe XXIII at 00:23:37 UT; Si VII shows no
significant brightening at this location, but its intensity becomes slilghtly
enhanced around 00:25:06 UT. In frame (b) Fe XVI exhibits a small but significant
redshift starting at 00:23:26 UT, and Fe XIV exhibits a small but significant
redshift starting at 00:23:04 UT.
The density sensitive line intensity ratio of Fe XIV 264.8/274.2 observed by EIS
reveals an increase of electron density from (1.03 +/- 0.20) X 10
9 before the flare
to (3.58 +/- 0.68) X 10
9 cm
-3 during the flare. This combination of redshifted
coronal line emission and increased coronal electron density is consistent with
explosively evaporated flare material observed by IRIS falling as warm rain and
accumulating in the remote area observed by EIS.
A thermal/nonthermal fit to the hard X-ray spectrum observed by RHESSI yields a
nonthermal energy injection rate of 4.9 X 10
26 ergs s
-1; combining this with an
estimated injection area of (2.1 +/- 1.7) X 10
17 cm
2 based on the brightening seen
in IRIS slit-jaw images during the rise of the flare, we estimate a HXR beam energy
flux of (6.7 +/- 5.5) X 10
9 ergs cm
-2 s
-1, a wide range whose larger values are
consistent with explosive evaporation.
The link to the paper is here:
Explosive Chromospheric Evaporation and Warm Rain in a C3.1 Flare Observed by IRIS, Hinode/EIS, and RHESSI.
References
Brosius, J. W., & Daw, A. N. 2015, ApJ, 810, 45
Brosius, J. W., Daw, A. N., & Inglis, A. R. 2016, ApJ, 830, 101
Brosius, J. W., & Inglis, A. R. 2017, ApJ, 848, 39
Kamio, S., Fredvik, T., & Young, P. R. 2011, EIS Software Note 5
Kamio, S., et al. 2010, Sol. Phys., 266, 209
Kelly, R. L. 1987, J. Phys. Chem. Ref. Data, 16, Supplement 1
Young, P. R., Tian, H., & Jaeggli, S. 2015, ApJ, 799, 218


