Getting it all from spectra! Measuring velocities in the early stages of an eruption using the wide slot data from Hinode EIS
Louise Harra, George Doschek, Sarah Matthews, Harry Warren, Len Culhane, Magnus Woods
Using spectrometers there are always compromises:
1) a slit spectrograph requires rastering to build up an image, which takes time, so what you gain in imaging you lose in temporal resolution;
2) sitting in one location (known as sit and stare) allows you to keep the temporal resolution, but you lose the spatial information.
Hinode EIS has 4 slit/slot options. The 1" and 2" slits are used for rastering data to build up images or for sit and stare data. The two slots that are available are the 40" and the 260". In the slot data the spectral and spatial dimension (in the x axis) is combined. If you look back to Skylab overlappogram data this shows you how the spatial and spectral dimension are merged - you see multiple images of the Sun along the wavelength scale. See Figure 1.
Figure 1: Skylab overlappogram.
In the EIS wide slot case the field of view is smaller but covers a full active region. It is often used to collect data at a minute cadence to determine if a flare has occurred - the He II 304 data is used for this, as once a flare is registered, the mode can switch into raster mode at the flare location. Since the slot data is regularly used as a flare trigger there is an extensive database of slot data in the early (and important) stages of a flare.
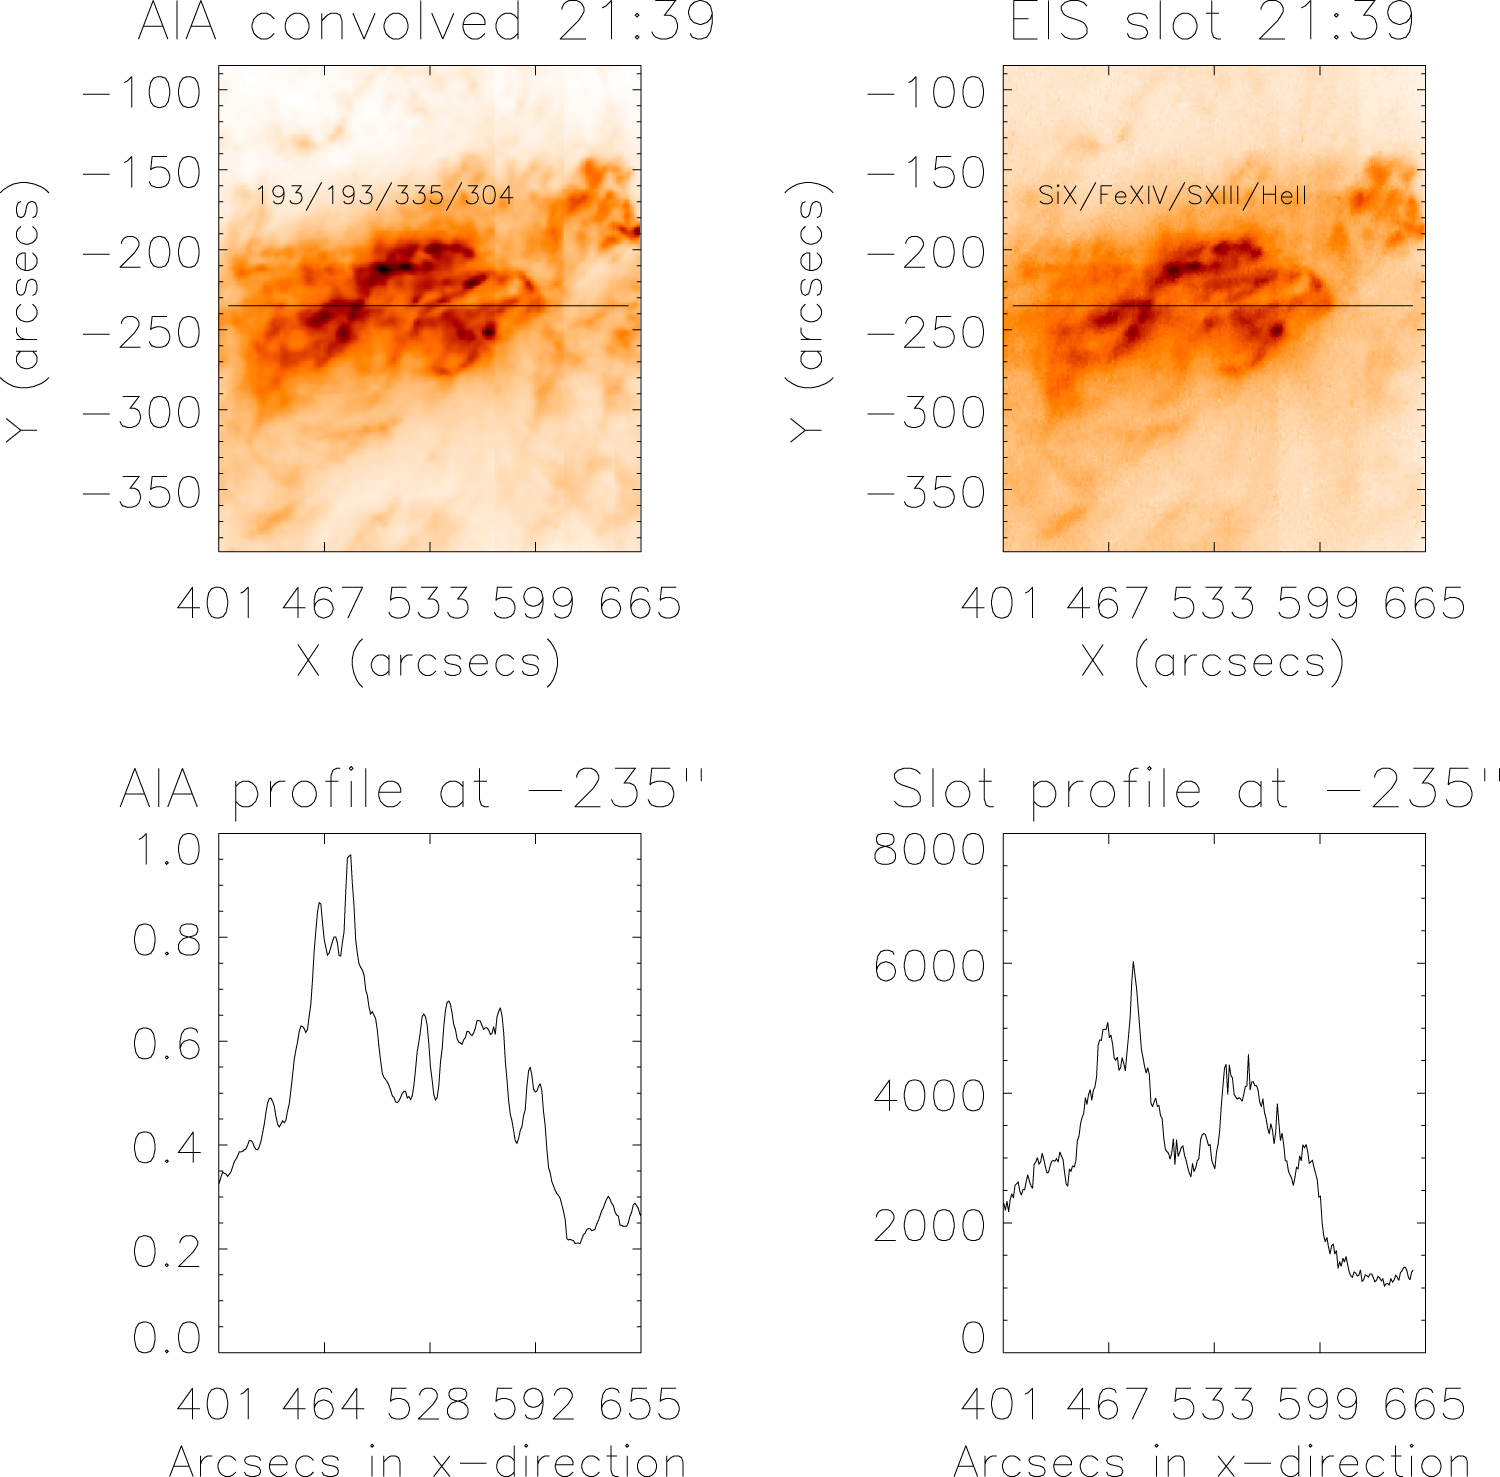
We took a set of this data, and using AIA data, we convolved equivalent filters to the emission lines in the slot band. This allowed us to identify spatial changes in the build up to a flare that may be confused with spectral changes. Figure 2 shows the deconvolved AIA data at one time, along with the slot data. The bulk features are matched pretty well. These images were taken well before the flare began.
Figure 2: Active region data before the flare begins. The top panel shows convolved AIA data (left) and the EIS slot data (right). AIA filters used to emulate the emission lines seen in the EIS slot data are labeled on the AIA image (active region ratios: 193 - 36% / 193 - 30% / 335 - 50% / 304 - 100%). The order of the emission lines seen in
the slot band are labeled on the EIS slot image. Dispersion axis of EIS is from right to left and hence the wavelength is reversed. Bottom panel shows profiles along the images at
y = -235". The similarity in the behavior of the 2 profiles indicates that the approximate ratios of the emission lines selected are reasonable.
If we then look at a time just as the flare is beginning, you can clearly notice in the EIS slot data that in the x-direction (wavelength direction) features broaden. This is when strong flows are seen. Comparing with the width of the spatial features in AIA can provide us with an estimate of Doppler velocities. The horizontal profiles across AIA and EIS show that EIS is much broader and is shifted at this time giving velocities across the whole active region simulatenously!
Figure 3: Flare data during the rise phase. Panels are the same as in Figure 2. Flare ratios are 193 - 11% / 193 - 13% / 335 - 46% / 304 - 100% / 131 - 30%. The flare data has an additional Fe XXIV emission line that becomes strong, indicated by the black arrow. The dotted line shows what the AIA profile would like by assuming the active region ratios in Figure 2. Once again, the AIA and slot profiles are similar, confirming the robustness of the emission line ratios. Note the broader FWHM of the peaks in the EIS slot data compared to the equivalent AIA peaks. This broadening in the disperison direction is EIS is related to dynamics.
Looking at slot movies by eye alone can allow you to highlight
regions of strong flows. Have a look at this movie:
Slot Movie of EIS He II 256 A data from 21:39 UT to 21:49 UT.