Dynamics of Late-Stage Reconnection in the 2017 September 10 Solar Flare
Ryan French - UCL/MSSL
Solar flares are a key form of energy release in the corona, as free energy stored in coronal magnetic fields converts into kinetic, thermal, and electromagnetic energy through the process of magnetic reconnection. In the standard solar flare model, reconnection is believed to power the impulsive phases of flares, typically lasting a few minutes to an hour. There has, however, been evidence to suggest that magnetic reconnection within flares can persist for much longer than this, with energy release timescales of tens of hours (Bruzek 1964), albeit at a more gradual rate than during the impulsive phase.
2017 September 10 saw the eruption of an X8.2-class flare on the western solar limb. Multiple aspects of this flare have been studied, in particular the long-lived plasma sheet structure, which rose above the solar limb behind the erupting coronal mass ejection (CME). Due to high temperatures and non-thermal velocities in the region (Warren et al 2018), the plasma sheet has been interpreted as hot, turbulent plasma, enclosing the current sheet at the site of magnetic reconnection. Observations of the impulsive phase of the flare have been thoroughly explored (e.g. Cheng et al 2018, Longcope et al 2018, Hayes et al 2019).
In this study, we provide additional evidence for sustained fast reconnection late in the flare's evolution, by examining plasma kinematics associated with the standard flare model with Hinode/EIS, Hinode/XRT, RHESSI and AIA DEMs, beyond the impulsive phase of the event. On even longer timescales we examine 2017 September 11 CoMP and K-Cor observations, showing that magnetic reconnection is still occurring in the plasma sheet structure, over a day into the event (and several hours after its last appearance in EUV).

Figure 1: From left to right, the three columns show data at 2017 September 10 16:44, 18:39, and 19:23 UT. Top: MGN-sharpened (Morgan & Druckmuller 2014) AIA 193 Å observations. Blue contours show regions of highest EIS nonthermal velocities. The red X marks the location of the highest 12-25 keV RHESSI emission. Second row: EIS 192.04 Å intensity measurements. Bottom row: EIS 192.04 Å Doppler velocity measurements (km s^-1). A diffraction pattern is visible in earlier frames, seen as a cross emanating from the brightest region.
Hinode EIS captured the flare from its onset at 15:44 UT, past its peak at 16:06 UT, up to 16:52 UT. Observations later continued at 18:39 UT, observing the late evolution of the flare until 19:31 UT. There was a shift in the FOV between these times. Figure 1 shows the evolution of the flaring region from the last EIS raster of the earlier observing sequence (16:44 UT) and the first and last rasters of the later observing sequence (18:39 and 19:23 UT). Both AIA 193 Å and EIS Fe XXIV 192.04 Å measure hot plasma in the bright primary flare loops and the prominent horizontal plasma sheet structure. Later in the flare, EIS observes these two structures appear to blend into one, forming the dominant cusp feature. The top row shows AIA 193 Å observations, overlaid with RHESSI 12-25 keV source height and contours of the highest velocities. The source of fastest nonthermal velocities rises with time, a continuation of what is seen in the first few EIS rasters of the flare (Warren et al 2018). This non-thermal velocity structure is long-lived, with peak velocities falling only from 90 km/s to 80 km/s between 22 and 189 minutes after flare onset.
The bottom row of Figure 1 shows observed Doppler velocities. From at 18:39 UT onwards, the smallest loops closest to the limb are blueshifted on the southern half of the loop, and redshifted on the northern half, while the higher flare loops and cusp region display the opposite behaviour. The blueshifted regions show areas of plasma with a component flowing toward the observer, consistent with plasma flowing down from the top of the newly reconnected flare loops. This Doppler pattern gives us an indication of the orientation of the flare loops, tilted slightly in either the north or south direction but varying with altitude. Such an effect could be due to higher altitude loops forming with lower shear. Blueshifted plasma at the edge of the FOV (around 32 km s-1 in the LOS at 18:39 UT) are likely a result of plasma downflows from the plasma sheet, tilted slightly away from the observer.
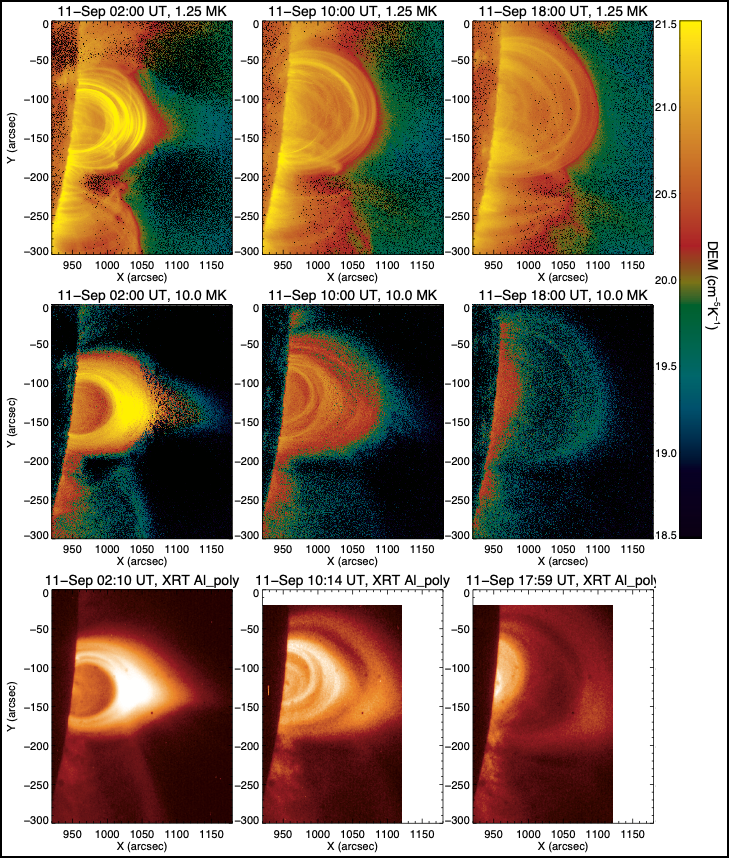
Figure 2: Top: time evolution of AIA 1.25 MK DEMs. Middle: time evolution of AIA 10 MK DEMs. Bottom: time evolution of XRT Al poly.
After forming due to magnetic reconnection, individual flare loops shrink rather than expand (e.g., Forbes & Acton 1996). Therefore, the continued expansion of a flare loop arcade indicates the formation of newly reconnected loops at increasing heights as a result of ongoing reconnection. In Figure 2 we see this growth at different temperatures, showing the evolution of emission measure (EM) for 1.25 and 10.0 MK plasma, (constructed using the DEM code of Hannah & Kontar 2013). On September 11 at 02:00 UT, 10 hr after the flare onset, the base of the plasma sheet is still visible at the high temperature DEMs. The flare loops also have a more 'cusp-like' shape, in comparison to the relaxed lower-temperature loops (Gou et al 2015). This cusp structure is also visible in XRT Al poly observations, sensitive to plasma at around 6.9 MK. This cusp feature seems to tilt to the south over the next 8 hr, where we see a small plasma sheet signal visible in the high-temperature DEMs at 11 September 10:00 UT.
According to the standard model, the presence of a cusp implies the existence of a reconnecting current sheet above it. As seen in Figure 2, there is no evidence of this in EUV images beyond around September 11 10:00 UT. To detect the remnants of the diffuse plasma sheet above our cusp, we turn to polarized infrared (CoMP) and white-light (K-Cor) data. K-Cor observes photospheric photons scattered by electrons in the corona and measures a variation in brightness with electron density Ne (rather than Ne^2 for EUV images, Landi et al 2016). Due to this difference in density dependence, K-Cor can observe more diffuse coronal structures at much higher altitudes. Figure 3B shows normalised white-light polarized brightness (pB) measurements from K-Cor, showing clearly the plasma sheet emanating from the cusp top.
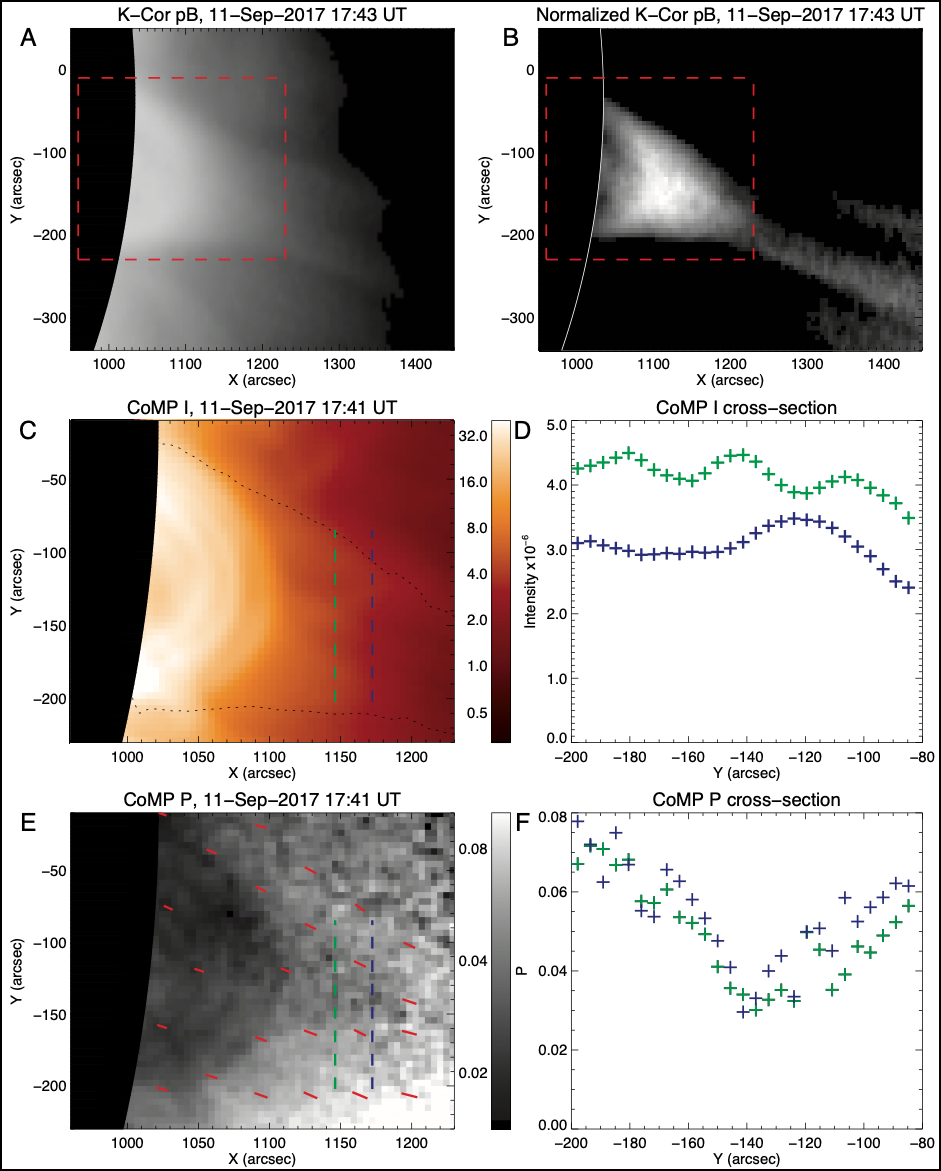
Figure 3: A: K-Cor polarized brightness, pB. The red dashed box shows the FOV of CoMP panels. B: K-Cor pB, normalized by mean brightness at each altitude. C: CoMP 1074.7 nm intensity. The black dotted contour marks the location of the K-Cor cusp feature in panel B. D: cross section of CoMP I, at locations marked in panel C with corresponding colours. E: CoMP normalized linear polarization, P = sqrt(Q^2 + U^2)/I. Red lines are polarization vectors. F: cross section of CoMP P, at locations marked in panel E with corresponding colours.
Using infrared polarization measurements from CoMP, we can examine more closely the base of the plasma sheet structure observed by K-Cor. We repeat the method used in French et al 2019 for observations at September 11 17:41 UT. Figure 3C shows a low triangular feature in linear polarisation, above the flare loops. We find that the low minimum value of P=0.035 cannot be a result of collisions within the plasma, and is inconsistent with the presence of a laminar magnetic field within the plasma sheet. As in French et al 2019, we interpret this to be a result of structured magnetic field in the LOS and POS on sub-pixel scales, implying the continued presence of magnetic reconnection. The fact that infrared linear polarization measurements can detect signatures of reconnection in this way, despite no visual signatures in EUV, has exciting implications for off-limb flare observations from the DKIST CRYO-NIRSP instrument.
In this work we have shown that the configuration and signatures of dynamical energy release associated with the flare impulsive phase are still present many hours into the flare's evolution, indicating that fast reconnection is likely still occurring at least 27 hours after the flare onset in this case. These observations suggest that there is still much to be learned from the evolution of what is quickly becoming one of the most-studied solar flares of all time.
For more details, see French et al, ApJ, 900:2, 2020:
Dynamics of Late-Stage Reconnection in the 2017 September 10 Solar Flare
References
Bruzek, A. 1964, ApJ, 140, 746
Cheng, X., Li, Y., Wan, L. F., et al. 2018, ApJ, 866, 64
French, R. J., Judge, P. G., Matthews, S. A., & van Driel-Gesztelyi, L. 2019, ApJL, 887, L34
Gou, T., Liu, R., & Wang, Y. 2015, SoPh, 290, 2211
Hannah, I. G., & Kontar, E. P. 2013, A&A, 553, A10
Hayes, L. A., Gallagher, P. T., Dennis, B. R., et al. 2019, ApJ, 875, 33
Landi, E., Habbal, S. R., & Tomczyk, S. 2016, JGRA, 121, 8237
Longcope, D., Unverferth, J., Klein, C., McCarthy, M., & Priest, E. 2018, ApJ, 868, 148
Morgan, H., & Druckmuller, M. 2014, SoPh, 289, 2945
Warren, H. P., Brooks, D. H., Ugarte-Urra, I., et al. 2018, ApJ, 854, 122
Next EIS Nugget »» coming soon...
TBC
Last Revised: 27-Oct-2011
Feedback and comments: webmaster
|


