Forward Modeling of Solar and Stellar Coronal Magnetic-field Measurements Based on a Magnetic-field-induced Transition in Fe X
Yajie Chen, Hui Tian, Xianyu Liu (Peking University) and Wenxian Li, Xianyong Bai (National Astronomical Observatories, Chinese Academy of Sciences)

The magnetic field is the key to understanding the physical processes in the solar and stellar atmosphere. However, routine magnetic field measurements of solar and stellar coronae are still missing. Spectropolarimetric measurements of the coronal magnetic fields are challenging because of the weakness of polarimetric signatures in the corona (Lin et al. 2004). Recently, the magnetoseismology technique has been used to map the global coronal magnetic-field (Yang et al. 2020a,b). However, it is limited to limb observations. Another approach is to infer the magnitudes of solar and stellar coronal magnetic field from radio observations (e.g., Fleishman et al. 2020). However, the radio emission mechanisms, which are critical for determination of the field strengths, are not always evident from observations.
Recently, Li et al. (2015, 2016) proposed that the magnetic-field-induced transition (MIT) of the Fe X 257 Å line can be used to measure the coronal magnetic field. This technique has been recently applied to solar extreme ultraviolet (EUV) spectral observations taken by EIS onboard Hinode (e.g., Si et al. 2020; Landi et al. 2020, 2021; Brooks & Yardley 2021). However, the MIT technique has not yet been validated. So here we aim to verify the suitability and evaluate the accuracy of this technique in magnetic field measurements for the solar corona as well as the coronae of other late-type stars through the approach of forward modeling.
The MIT Technique
Based on the MIT theory, an external magnetic field can increase the transition probability between the Fe X 3p4 3d 4D7/2 and the ground 3p5 2P3/2 levels, resulting in enhanced emission of the Fe X 257 Å line. Thus, the intensity ratio of the Fe X 257 Å line to an Fe X reference line that is not sensitive to the magnetic field (257/ref) can be used to measure the magnetic field strength. The Fe X 174, 175, 177, 184, and 255 Å lines can be adopted as candidates of reference lines. Taking the 257 and 174 line pair as an example, these line ratios also depend on the temperature and electron density (see Figure 1). Thus, we need to determine both the temperature and density before deriving the magnetic field strength.
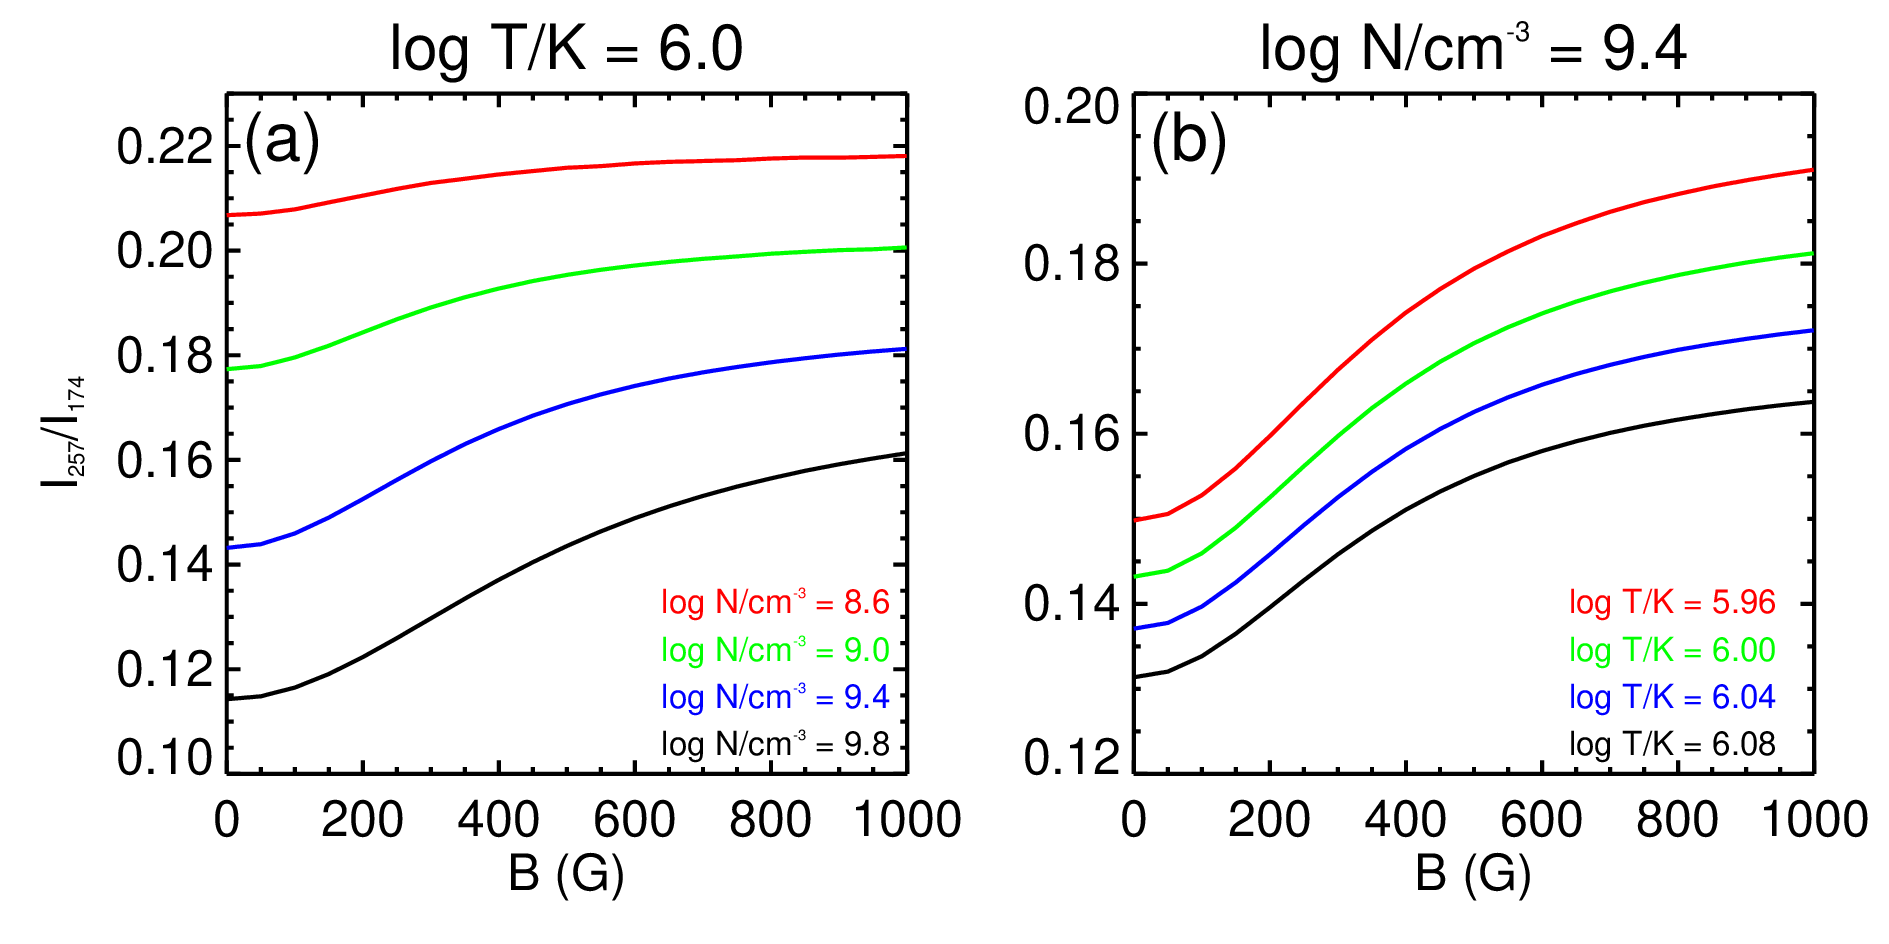
Figure 1: (a) Intensity ratio of the Fe X 257 and 174 Å lines, I257/I174, as a function of the magnetic-field strength at a temperature of 106.0 K and densities of 108.6, 109.0, 109.4, and 109.8 cm-3, and (b) at a density of 109.4 cm-3 and temperatures of 105.96, 106.00, 106.04, and 106.08 K.
Solar coronal magnetic field measurements
To verify the suitability of the MIT technique, we constructed a 3D radiation magnetohydrodynamics (MHD) model of a solar active region and took a snapshot from the model. Figure 2(a) presents the photospheric magnetogram showing a bipolar sunspot pair in the simulation domain. We synthesized the intensities of the Fe X lines. Figure 2(b) shows the Fe X 174 Å line intensity map integrated along the vertical direction with typical coronal loop structures.
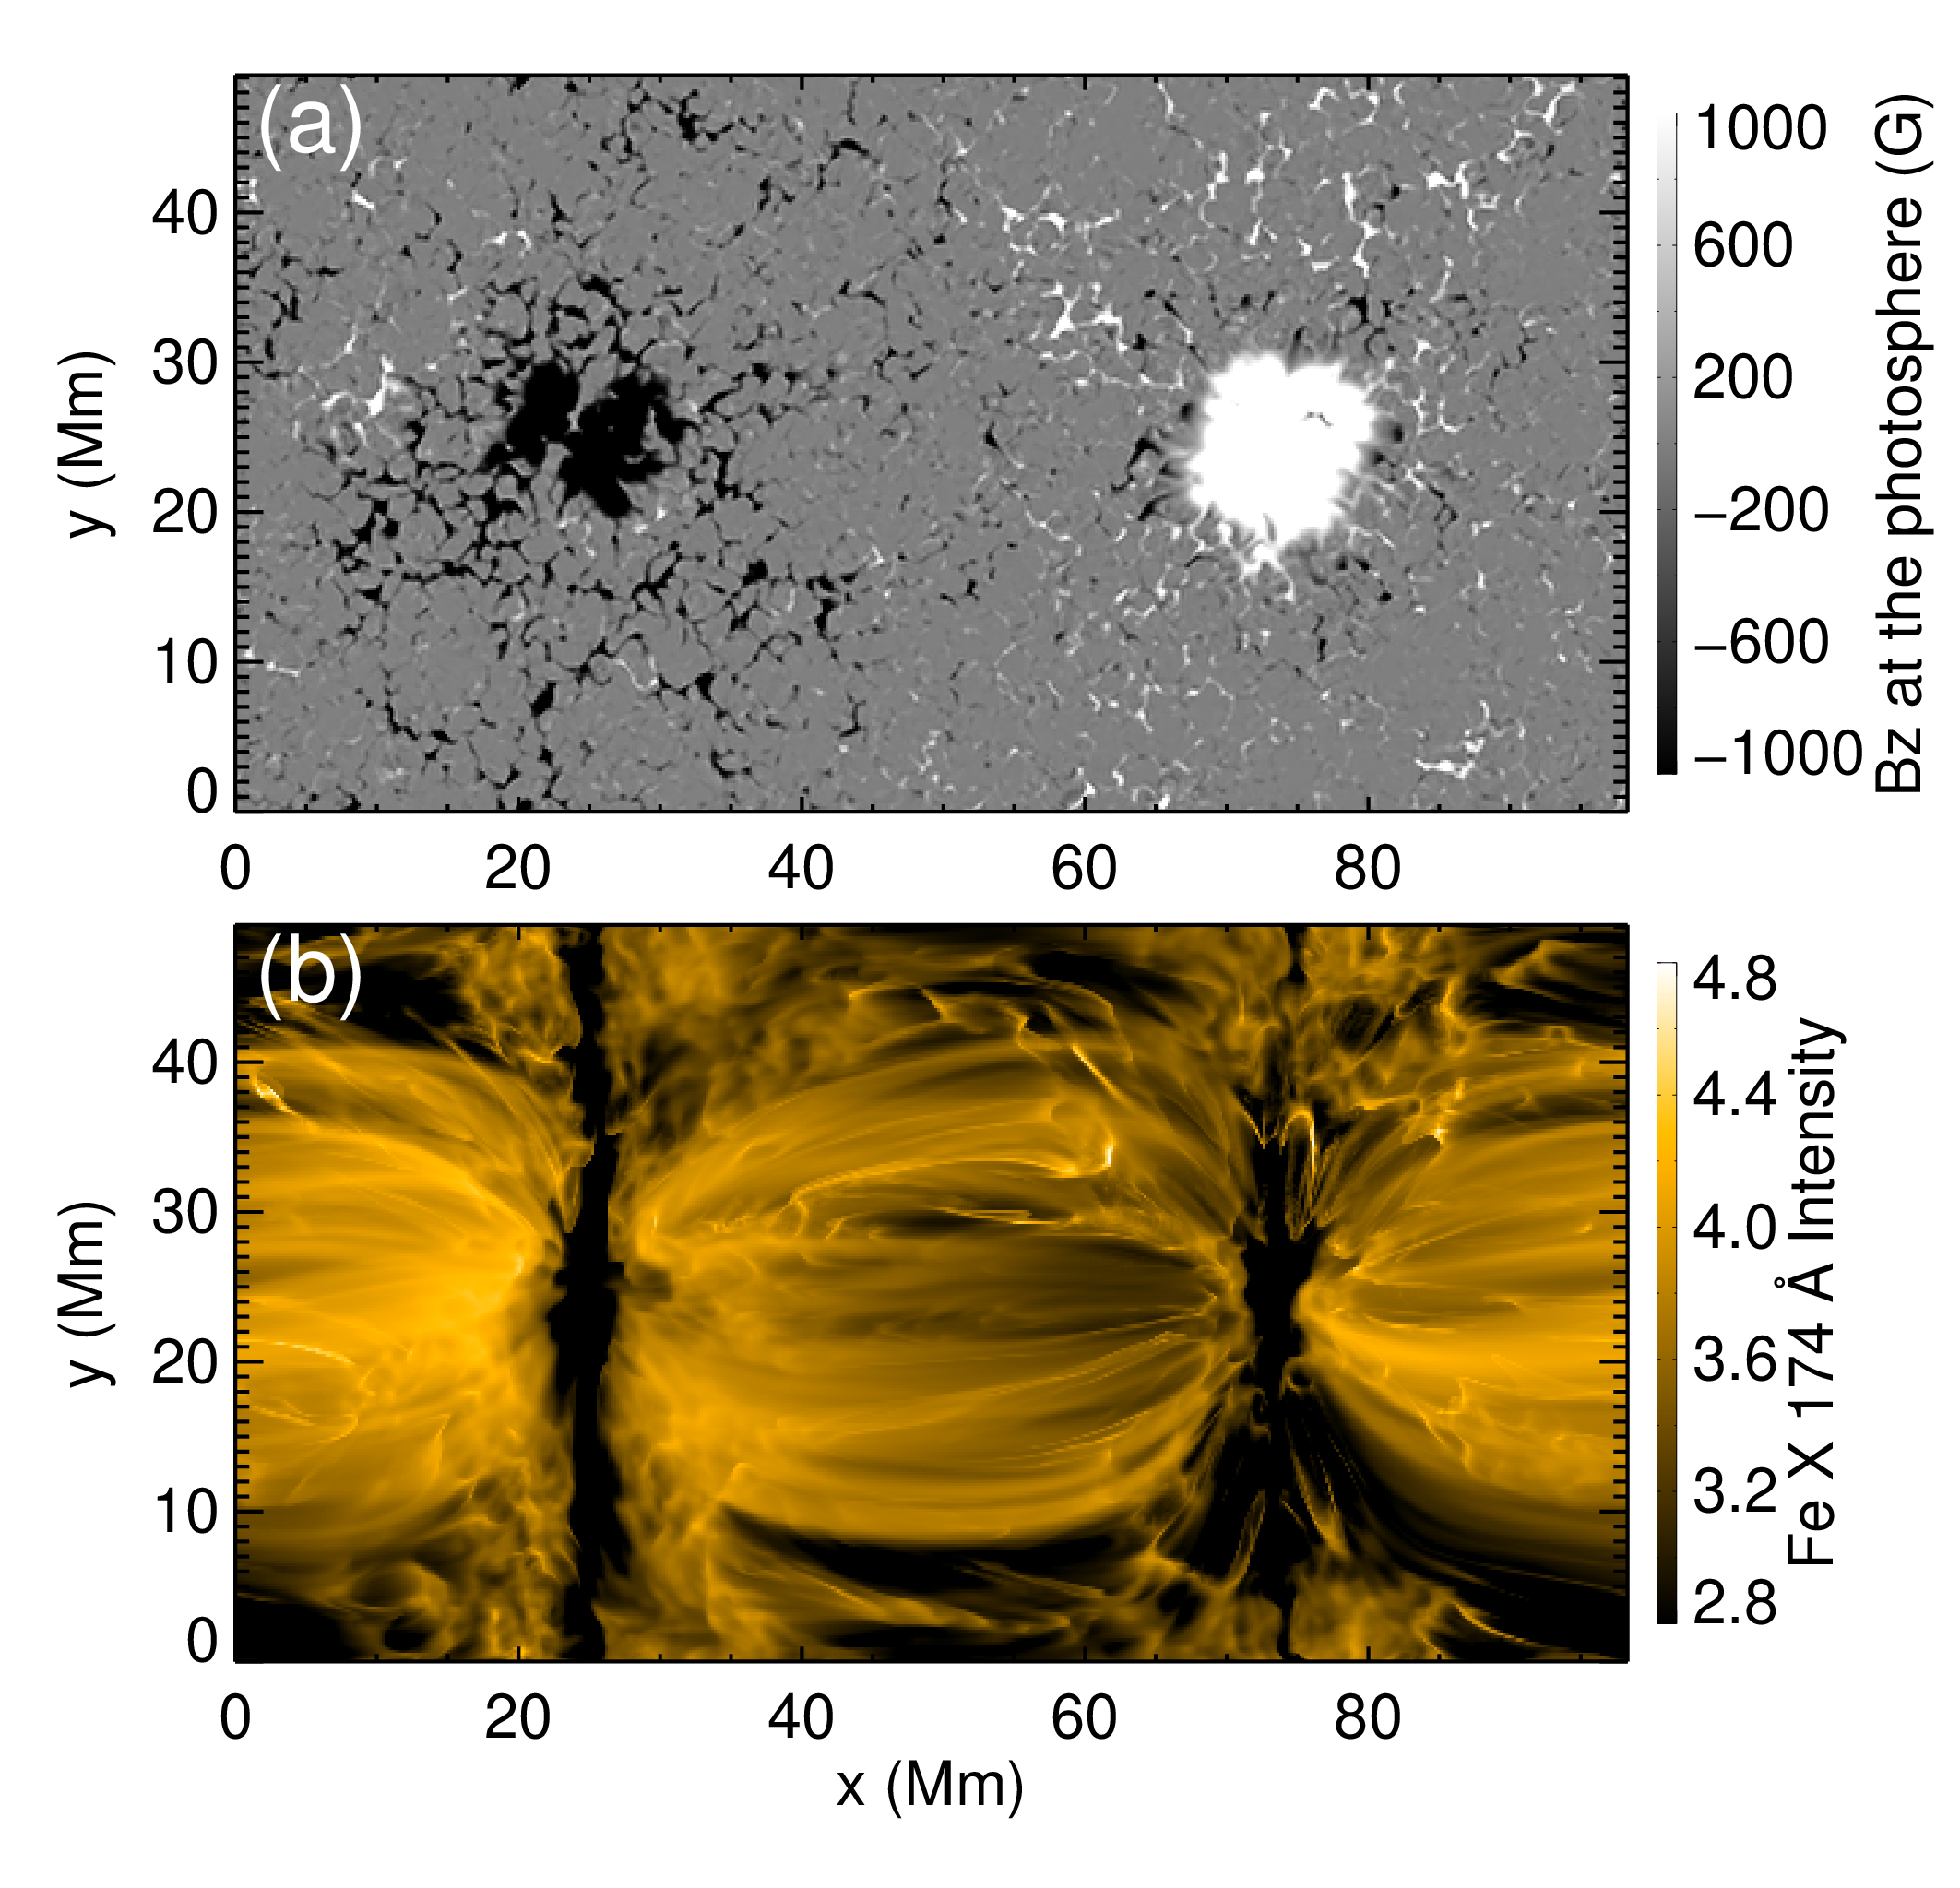
Figure 2: Overview of the solar active region model. (a) Vertical component of the photospheric magnetic field. (b) Intensity map of the Fe X 174 Å line when viewed along the vertical direction, shown in a logarithm scale and arbitrary units.
We employed two methods to estimate the electron densities and temperatures. For the first method, we assumed a uniform temperature of 106.0 K and derived the density using the 174/175 Å line ratio. For the second method, we determined the temperature and density simultaneously from the 174/175 and 184/345 Å line ratios based on the least-squares technique. After estimating the density and temperature, the magnetic field strength was determined from the intensity ratio 257/ref based on the MIT technique. The comparisons between the MIT-measured magnetic field strength from 257/174 Å and those in the MHD model are shown in Figure 3. Note that the choice of different reference lines provides consistent results. Figure 3(b) indicates that under the assumption of a fixed temperature the method is only valid around the sunspot regions. From Figure 3, it is obvious that the least-squares method provides a much better estimation of the magnetic field strength, suggesting that the simultaneous temperature determination is of critical importance for coronal magnetic field measurements. However, the 345 Å line we adopted here for temperature measurements is not observed by Hinode/EIS. Ideally, a spectrometer that can simultaneously observe the Fe X 174, 175, 184, 257, and 345 Å lines would be needed. Alternatively, we may derive the temperature from a differential emission measure analysis, which is possible to achieve using EIS observations.
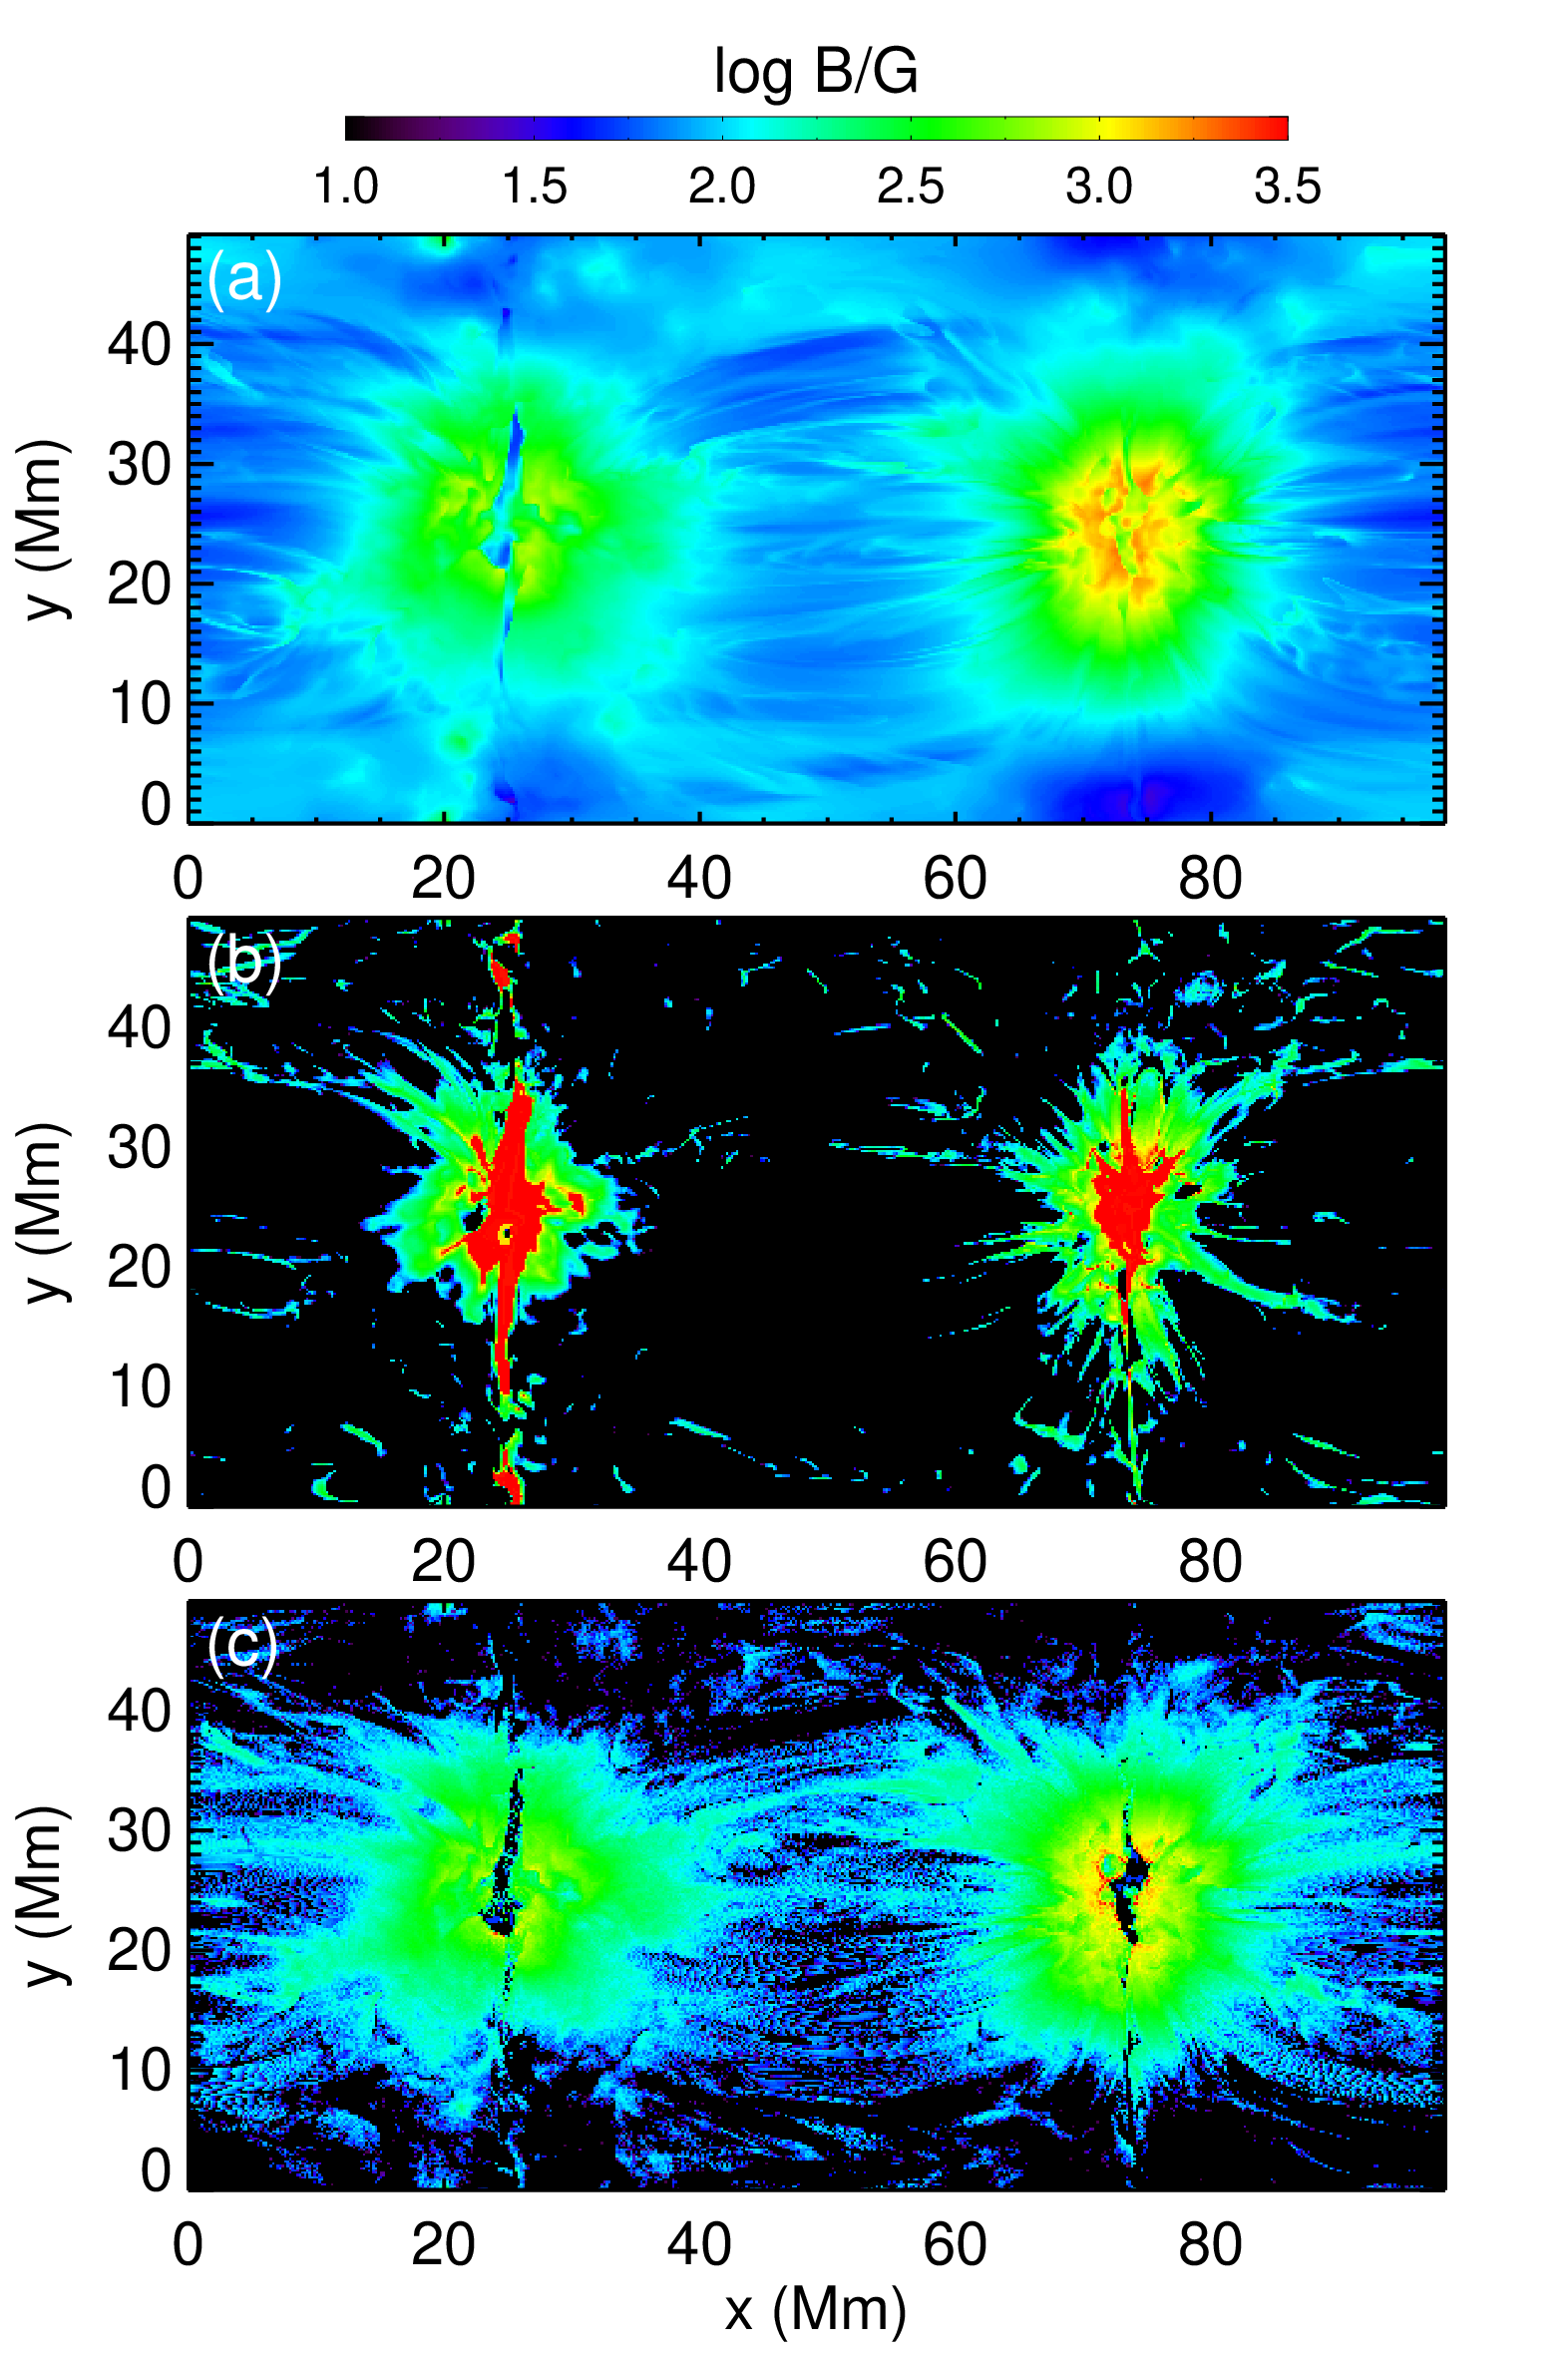
Figure 3: (a) Coronal magnetic-field strength in the model. (b) The derived magnetic-field strength using the intensity ratio of the Fe X 257/174 Å line pairs based on the MIT technique. We assumed a fixed temperature of 106 K at all pixels for the diagnostics of the electron density and magnetic field. (c) Similar to panel (b) but using the density and temperature maps derived from the least-squares method.
Furthermore, we applied the same diagnostic method to the mimicked off-limb observations and the results are shown in Figure 4. The MIT technique provides a reasonably good estimation of the magnetic field in the coronal loops. Thus, we conclude that the MIT technique can provide overall good measurements of the coronal magnetic field in both on-disk and off-limb solar observations.
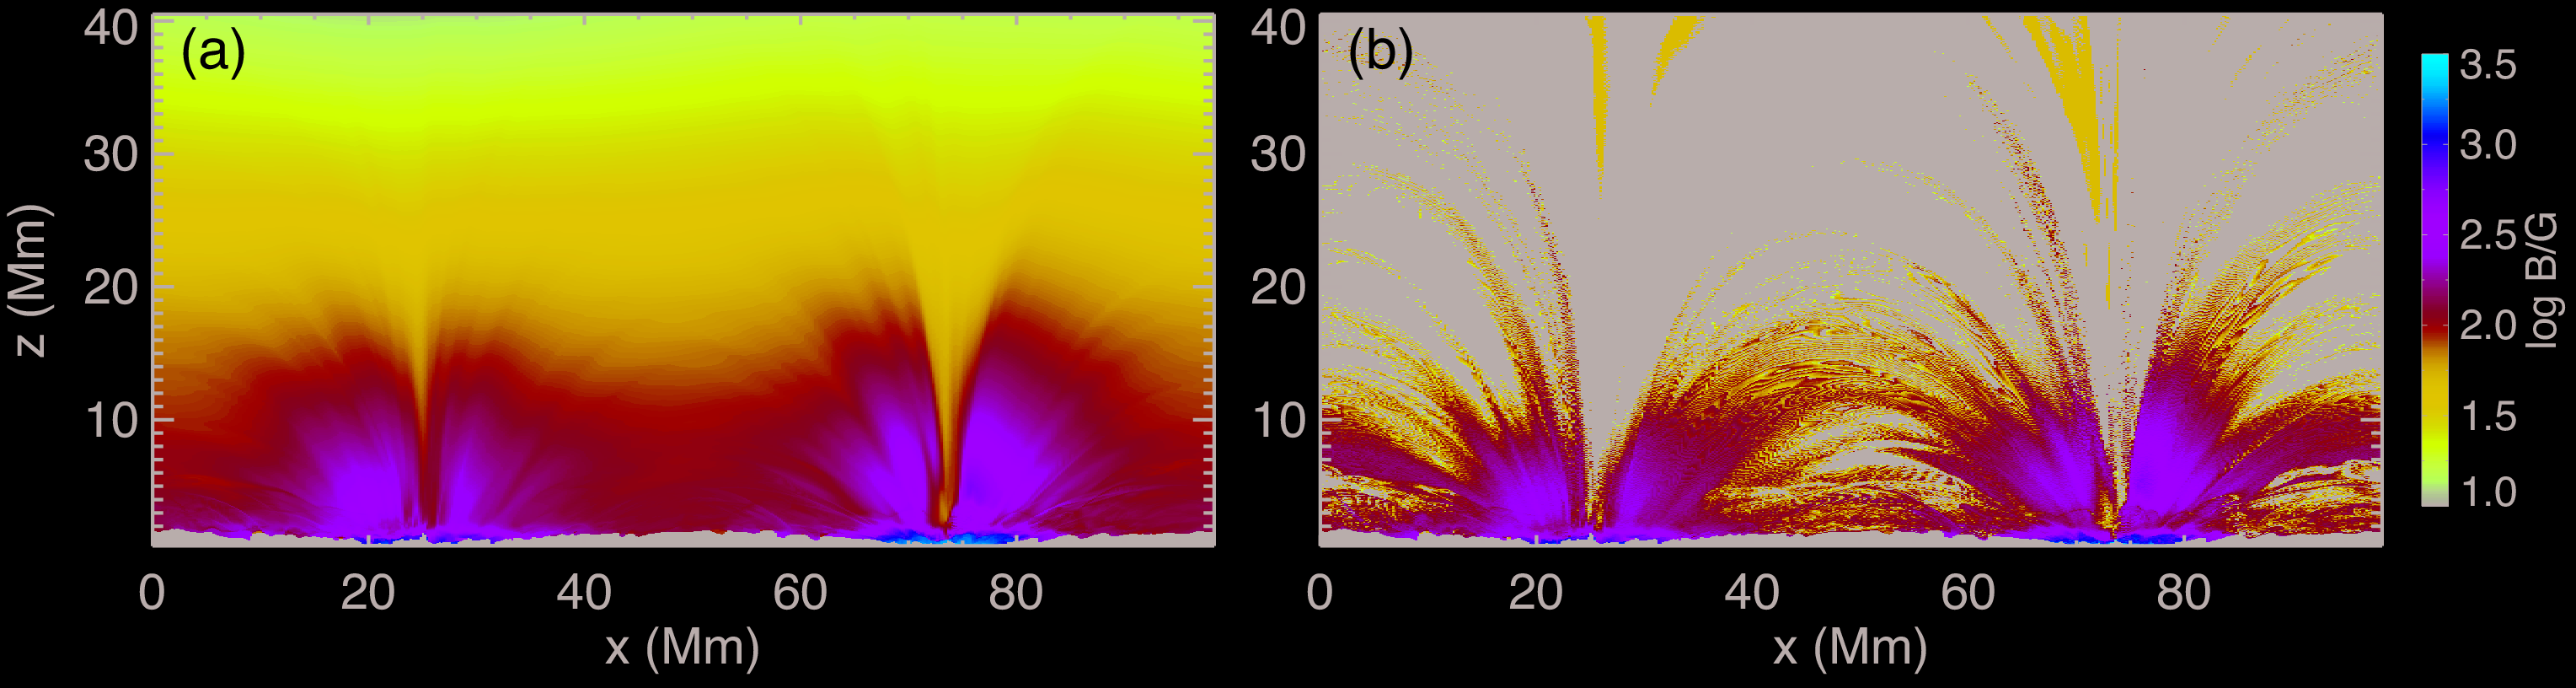
Figure 4: Similar to Figure 3 (a) and (c) but for a line-of-sight (LOS) along the y-axis.
Magnetic Field measurements for Stellar Coronae
To explore the possibility of extending this method to other late-type stars, we took a series of global stellar MHD models developed by Jin et al. (2020). We first constructed a steady-state global model based on the solar synchronous magnetograms obtained from SDO/HMI observations on 2011 Feb 15 (in the increasing phase of solar cycle 24) and then constructed another four steady-state models by multiplying the surface magnetic flux density by factors of 5, 10, 20, and 30, respectively, and referred to them as the "x5", "x10", "x20", and "x30" models. Figure 5 presents the radial component of the magnetic field at the stellar surfaces with the LOS along the +x-direction.
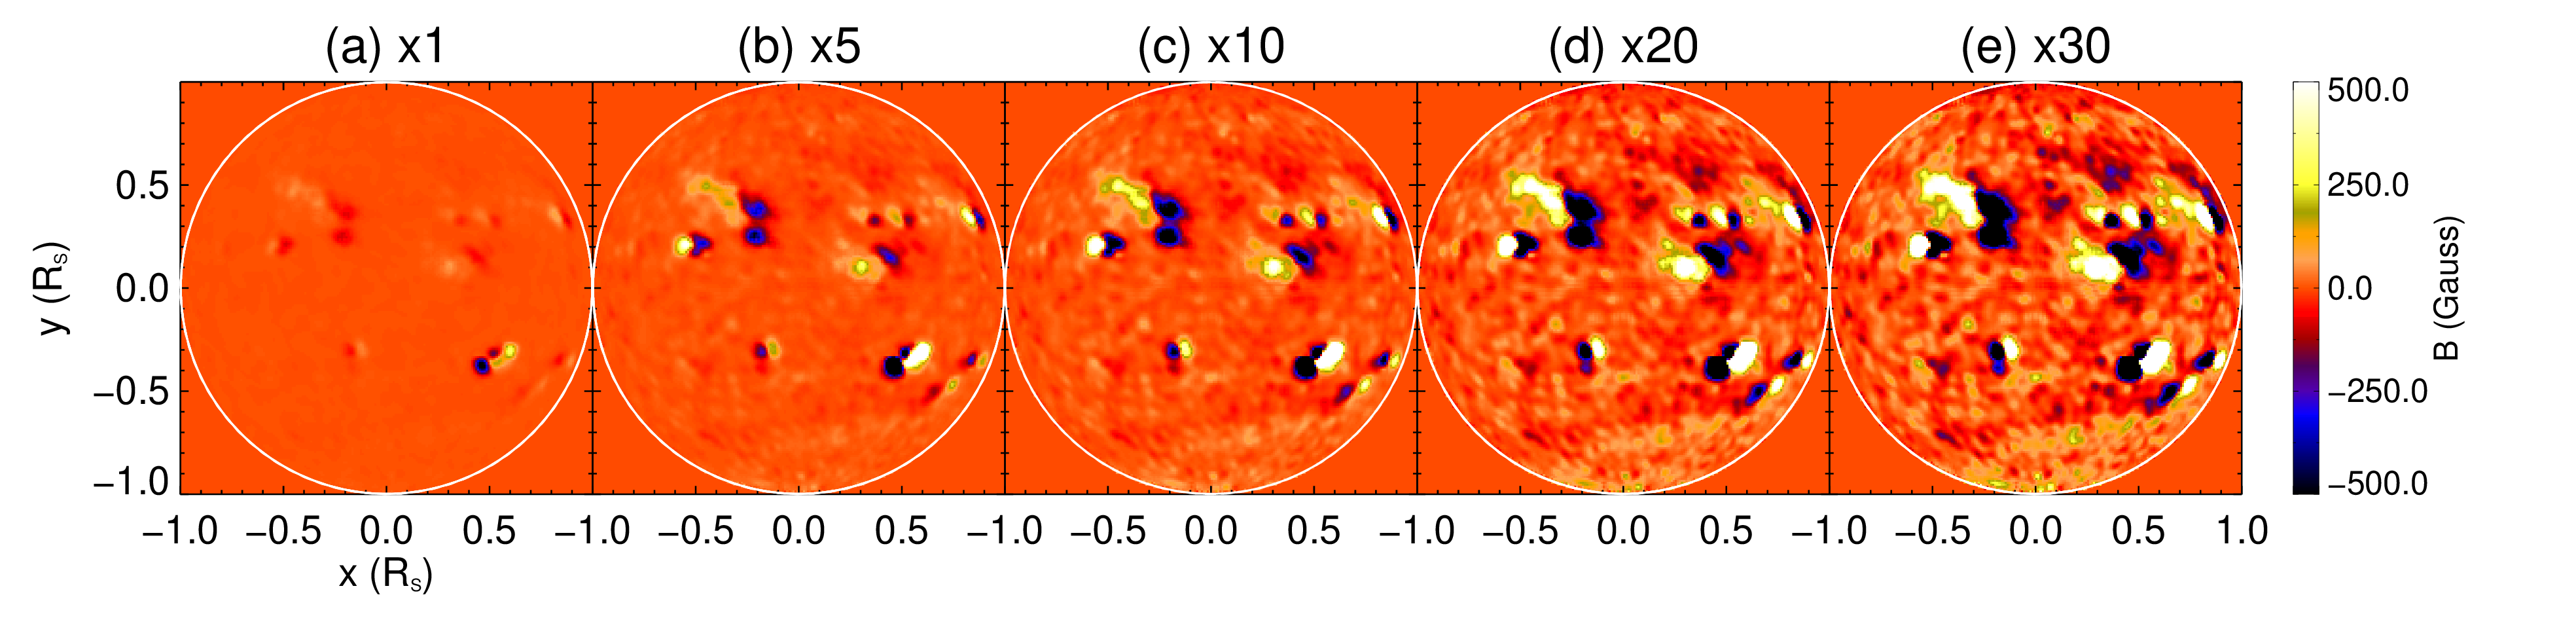
Figure 5: Radial component of the magnetic field at the stellar surface in different models. The +x-direction is taken as the LOS. The white circle in each panel indicates the limb of the photosphere.
Considering that stars are spatially unresolved when observed from the Earth, we synthesized the spectral line emissions of several Fe X lines integrated over the entire star. For each model, we diagnosed the electron density using the Fe X 174/175 Å line pair and then derived the magnetic field strength from the line ratios of the Fe X 257 Å line and other reference lines. At last, we compared the derived field strengths with those in the models.
We found that the line ratios of the Fe X 257 Å line and a reference 174, 177, or 184 Å line can provide reasonably accurate magnetic field measurements for the x20 and x30 models. The average coronal temperature in the x20 and x30 models reach up to 106.5 K, so the Fe X lines are likely formed in the coronal base of these models. Our investigation demonstrates that the MIT technique can be applied to measure the magnetic field strengths at the coronal bases of some nearby M dwarfs and young Sun-like stars whose surface magnetic flux densities are more than one order of magnitude higher than that of the Sun. A more recent analysis shows that the technique could also be applied to stars with a field strength comparable to that of the Sun if we use a solar photospheric magnetogram taken at the solar maximum to construct stellar models.
In summary, our investigations of forward modeling have verified that the MIT technique could provide reasonably accurate magnetic field measurements in the solar/stellar coronae. To achieve routine measurements of the corona magnetic field using the MIT method, EIS-like spectrometers that can simultaneously observe the Fe X 174, 175, 177, 184, 257 and 345 Å lines are highly desired.
For more details, see:
Chen et al., ApJ, 920:116, 2021:
Forward Modeling of Solar Coronal Magnetic-field Measurements Based on a Magnetic-field-induced Transition in Fe X
Chen et al., ApJL, 918:L13, 2021:
Measurementys of the Magnetic Field Strengths at the Bases of Stellar Coronae Using the Magnetic-field-induced Transition Theor
References
Brooks, D. H., & Yardley, S. L. 2021, SciA, 7, eabf0068
Fleishman, G. D., Gary, D. E., Chen, B., et al. 2020, Sci, 367, 278
Jin, M., Cheung, M. C. M., DeRosa, M. L., et al. 2020, in IAU Proc. 354, Solar and Stellar Magnetic Fields: Origins and Manifestations, ed. A. Kosovichev, S. Strassmeier, & M. Jardine (Cambridge: Cambridge Univ. Press), 426
Landi, E., Hutton, R., Brage, T., & Li, W. 2020, ApJ, 904, 87
Landi, E., Li, W., Brage, T., & Hutton, R. 2021, ApJL, 913, L1
Li, W., Grumer, J., Yang, Y., et al. 2015, ApJ, 807, 69
Li, W., Yang, Y., Tu., B., et al. 2016, ApJ, 826, 219
Lin, H., Kuhn, J. R., & Coulter, R. 2004, ApJL, 613, L177
Nakariakov, V. M., & Ofman, L. 2001, A&A, 372, L53
Si, R., Brage, T., Li, W., et al. 2020, ApJL, 898, L34
Yang, Z., Bethge, C., Tian, H., et al. 2020a, Sci, 369, 694
Yang, Z., Tian, H., Tomczyk, S., et al. 2020b, Sci China Tech Sci, 63, 2357
Next EIS Nugget »» coming soon...
TBC
Last Revised: 27-Oct-2011
Feedback and comments: webmaster
|

