Hinode/EIS HomeAll Years2006 | 2007 | 2008 | 2009 | 2010 | 2011 | 2012 | 2013
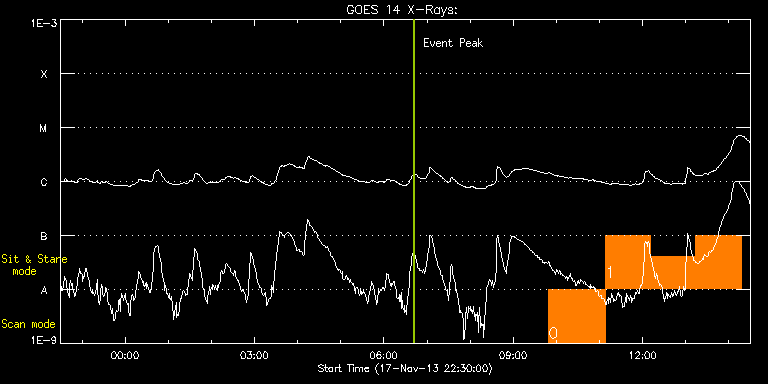
| Date | Begin | Max | End | Class | Location | NOAA | EIS Observations |
|---|---|---|---|---|---|---|---|
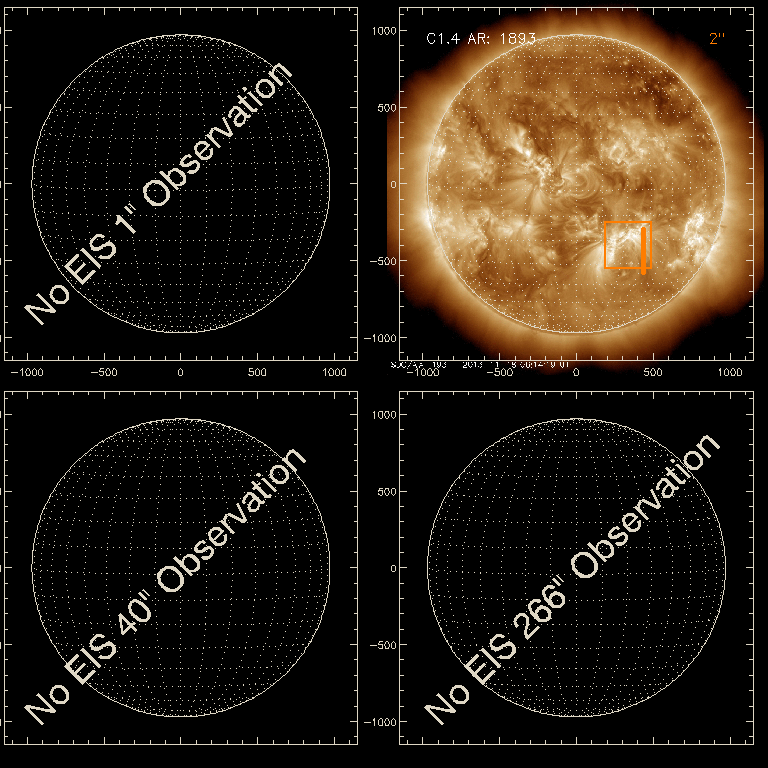
| 18-NOV-13 | 06:30 | 06:42 | 06:52 | C1.4 | 1893 | 20131118T0630.html |
| EIS FOV on background image (EIT/XRT/AIA full disk) | ||||||
|---|---|---|---|---|---|---|
 |
||||||
|
||||||