Hinode/EIS HomeAll Years2006 | 2007 | 2008 | 2009 | 2010 | 2011 | 2012 | 2013 | 2014
| Date | Begin | Max | End | Class | Location | NOAA | EIS Observations |
|---|---|---|---|---|---|---|---|
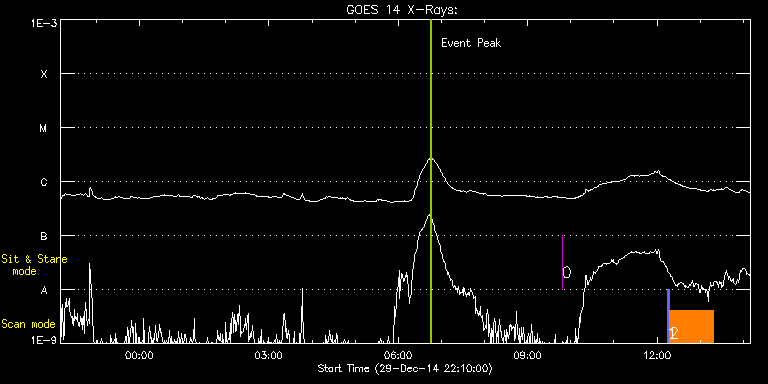
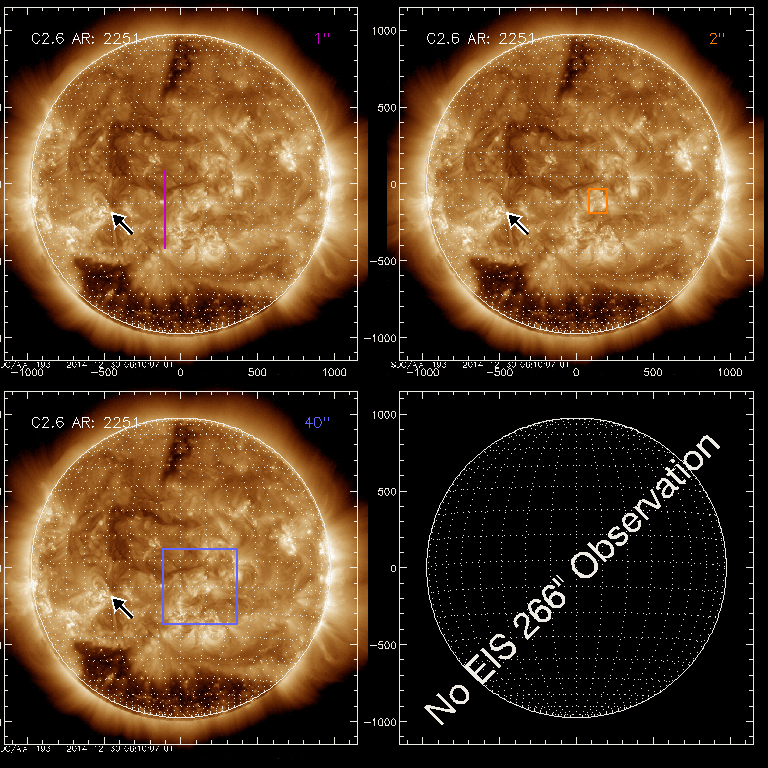
| 30-DEC-14 | 06:10 | 06:46 | 07:00 | C2.6 | S13E29 | 2251 | 20141230T0610.html |
| EIS FOV on background image (EIT/XRT/AIA full disk) | ||||||
|---|---|---|---|---|---|---|
 |
||||||
|
||||||