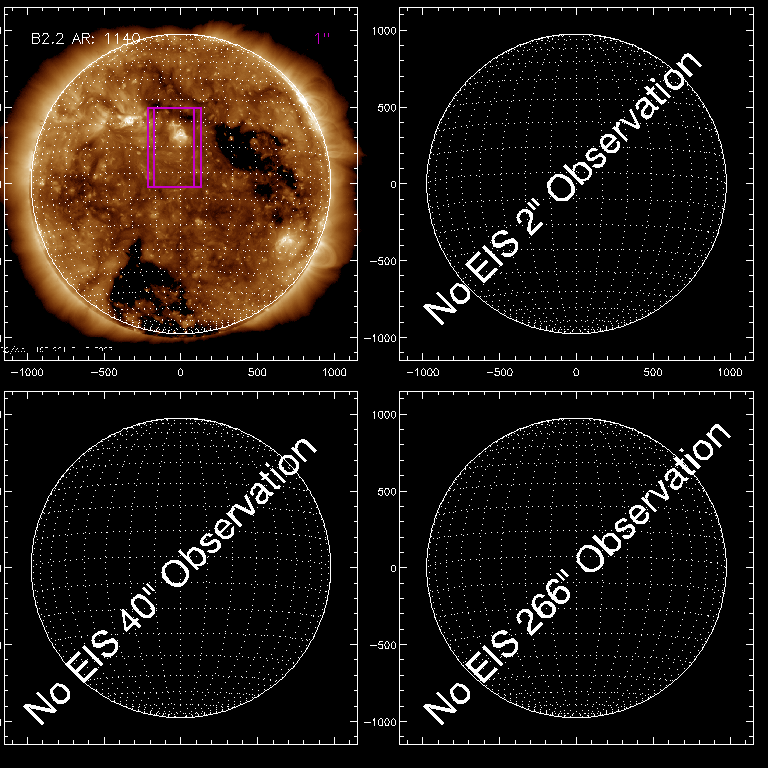
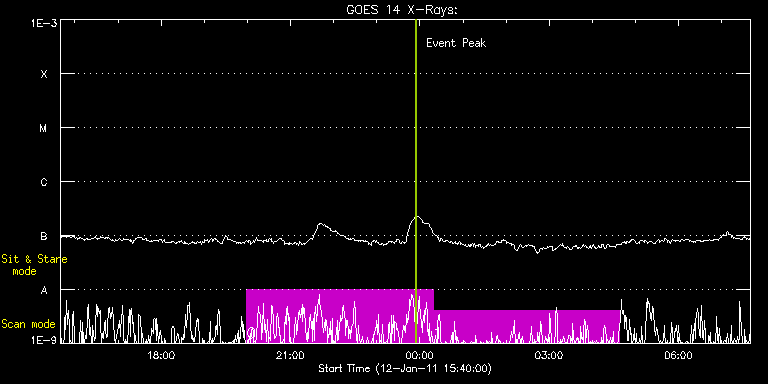
EIS Observation timeline overlay to GOES-Xray curve Code 1" 2" 40" 266" EIS Observations list for this event: STUDY ACRONYM ID DATE OBSERVED DESCRIPTION NOAA# TARGET 0 PRY_loop_velocity | 20706 | 2011/01/12 19:58:51 | Outflows from small ARs | | Active Region TIMELINE ID DATE OBSERVED FITS FILE XCEN (+W/-E) YCEN (+N/-S) DUR ----------------------------------------------------------------------------------------------------------------- 20706 | 2011/01/12 19:58:51.000 | eis_l0_20110112_195851.fits.gz | -58.56 | 234.29 | 4h19m30s 1 PRY_loop_velocity | 20707 | 2011/01/13 00:18:26 | Outflows from small ARs | 1146 | Active Region TIMELINE ID DATE OBSERVED FITS FILE XCEN (+W/-E) YCEN (+N/-S) DUR ----------------------------------------------------------------------------------------------------------------- 20707 | 2011/01/13 00:18:26.000 | eis_l0_20110113_001826.fits.gz | -19.39 | 234.52 | 4h19m29s : Check study information : Download file : View thumbnails For this event, also check for:
EIS Observations list for this event:
For this event, also check for:
 Hinode/EIS HomeAll Years2006 | 2007 | 2008 | 2009 | 2010 | 2011 | 2012