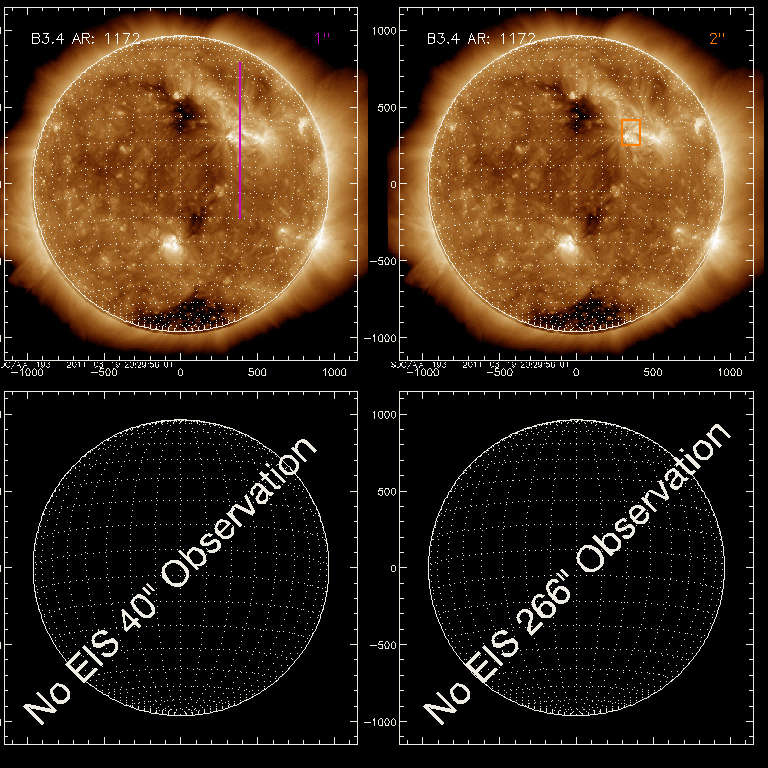
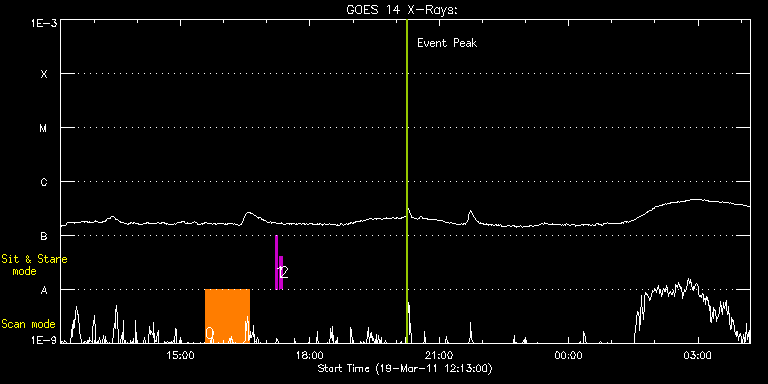
EIS Observation timeline overlay to GOES-Xray curve Code 1" 2" 40" 266" EIS Observations list for this event: STUDY ACRONYM ID DATE OBSERVED DESCRIPTION NOAA# TARGET 0 Atlas_60 | 21700 | 2011/03/19 15:34:09 | Active region spectral atlas. | 1175 | Quiet Sun TIMELINE ID DATE OBSERVED FITS FILE XCEN (+W/-E) YCEN (+N/-S) DUR ----------------------------------------------------------------------------------------------------------------- 21700 | 2011/03/19 15:34:09.000 | eis_l0_20110319_153409.fits.gz | 356.61 | 331.43 | 1h1m40s 1 regcal071 | 21701 | 2011/03/19 17:11:40 | Dark exposures, CCD bottom rows (100s | | Engineering TIMELINE ID DATE OBSERVED FITS FILE XCEN (+W/-E) YCEN (+N/-S) DUR ----------------------------------------------------------------------------------------------------------------- 21701 | 2011/03/19 17:11:40.000 | eis_l0_20110319_171140.fits.gz | 385.30 | 25.51 | 3m22s 2 regcal072 | 21702 | 2011/03/19 17:18:00 | Dark exposures, top CCD rows (100s exp | | Engineering TIMELINE ID DATE OBSERVED FITS FILE XCEN (+W/-E) YCEN (+N/-S) DUR ----------------------------------------------------------------------------------------------------------------- 21702 | 2011/03/19 17:18:00.000 | eis_l0_20110319_171800.fits.gz | 386.15 | 536.58 | 3m22s : Check study information : Download file : View thumbnails For this event, also check for:
EIS Observations list for this event:
For this event, also check for:
 Hinode/EIS HomeAll Years2006 | 2007 | 2008 | 2009 | 2010 | 2011 | 2012