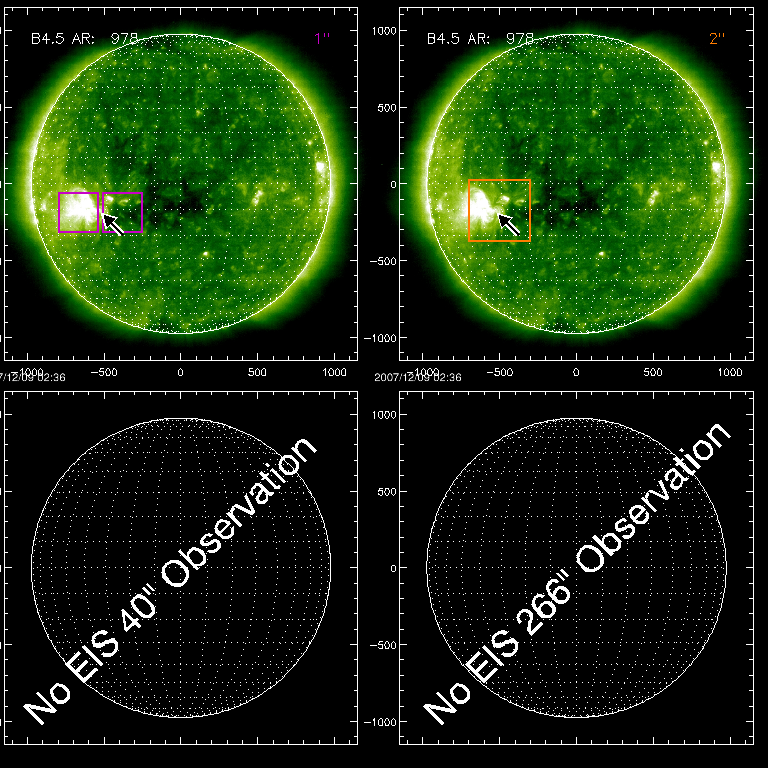
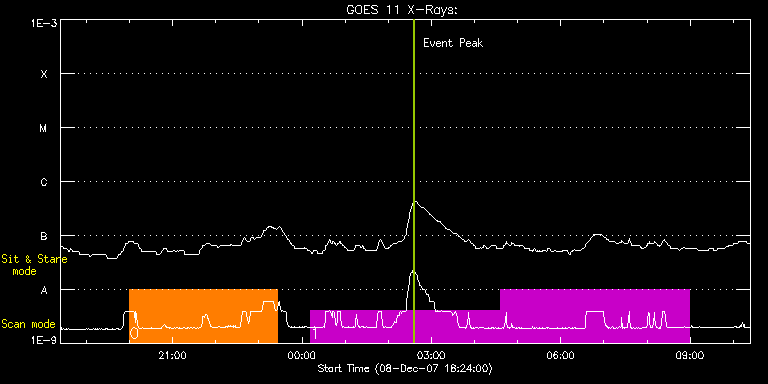
EIS Observation timeline overlay to GOES-Xray curve Code 1" 2" 40" 266" EIS Observations list for this event: STUDY ACRONYM ID DATE OBSERVED DESCRIPTION NOAA# TARGET 0 SYNOP004_400x400_30 | 6337 | 2007/12/08 20:00:26 | Large field of view raster on AR 10978 | 978 | Active Region TIMELINE ID DATE OBSERVED FITS FILE XCEN (+W/-E) YCEN (+N/-S) DUR ----------------------------------------------------------------------------------------------------------------- 6337 | 2007/12/08 20:00:26.000 | eis_l0_20071208_200026.fits.gz | -498.16 | -176.77 | 3h25m6s 1 GAD002_AR_rast | 6338 | 2007/12/09 00:12:26 | Small field of view rasters for AR 109 | 978 | Active Region TIMELINE ID DATE OBSERVED FITS FILE XCEN (+W/-E) YCEN (+N/-S) DUR ----------------------------------------------------------------------------------------------------------------- 6338 | 2007/12/09 00:12:26.000 | eis_l0_20071209_001226.fits.gz | -663.24 | -190.70 | 4h23m10s 6338 | 2007/12/09 04:35:39.000 | eis_l0_20071209_043539.fits.gz | -376.76 | -190.27 | 4h23m11s : Check study information : Download file : View thumbnails For this event, also check for:
EIS Observations list for this event:
For this event, also check for:
 Hinode/EIS HomeAll Years2006 | 2007 | 2008 | 2009 | 2010