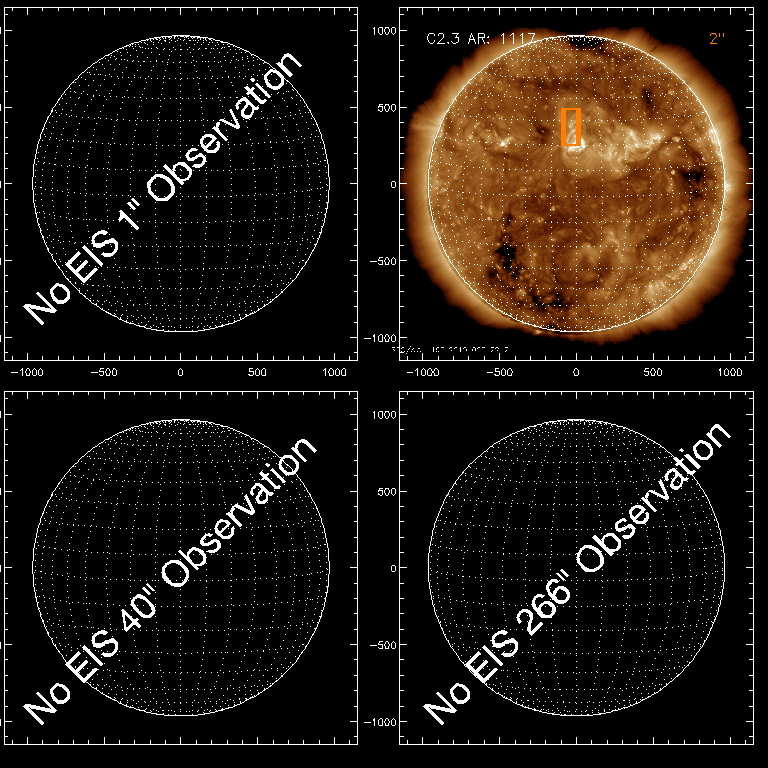
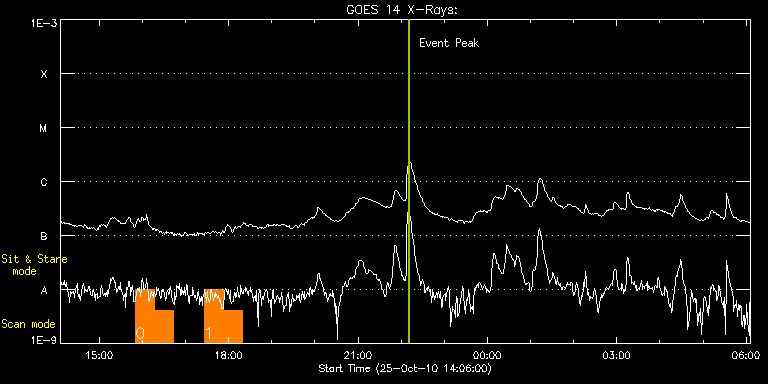
EIS Observation timeline overlay to GOES-Xray curve Code 1" 2" 40" 266" EIS Observations list for this event: STUDY ACRONYM ID DATE OBSERVED DESCRIPTION NOAA# TARGET 0 PRY_footpoints_lite | 19664 | 2010/10/25 15:50:32 | HOP 178. Dynamics of pores. AR 11117 r | | Active Region TIMELINE ID DATE OBSERVED FITS FILE XCEN (+W/-E) YCEN (+N/-S) DUR ----------------------------------------------------------------------------------------------------------------- 19664 | 2010/10/25 15:50:32.000 | eis_l0_20101025_155032.fits.gz | -41.55 | 366.34 | 26m23s 19664 | 2010/10/25 16:16:58.000 | eis_l0_20101025_161658.fits.gz | -37.92 | 366.50 | 26m22s 1 PRY_footpoints_lite | 19666 | 2010/10/25 17:26:12 | HOP 178. Dynamics of pores. AR 11117 r | | Active Region TIMELINE ID DATE OBSERVED FITS FILE XCEN (+W/-E) YCEN (+N/-S) DUR ----------------------------------------------------------------------------------------------------------------- 19666 | 2010/10/25 17:26:12.000 | eis_l0_20101025_172612.fits.gz | -28.26 | 366.50 | 26m22s 19666 | 2010/10/25 17:52:37.000 | eis_l0_20101025_175237.fits.gz | -24.40 | 366.42 | 26m23s : Check study information : Download file : View thumbnails For this event, also check for:
EIS Observations list for this event:
For this event, also check for:
 Hinode/EIS HomeAll Years2006 | 2007 | 2008 | 2009 | 2010 | 2011