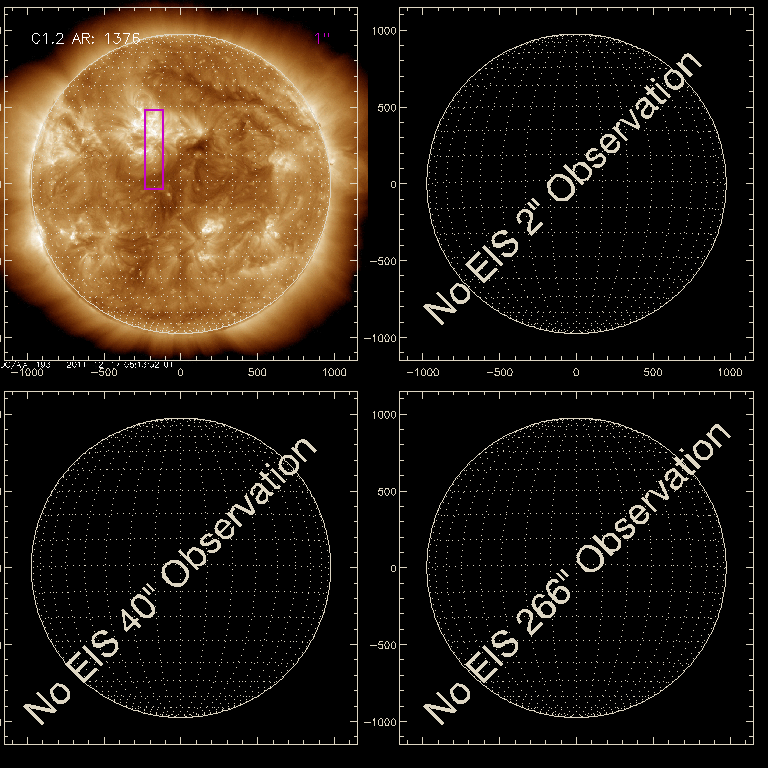
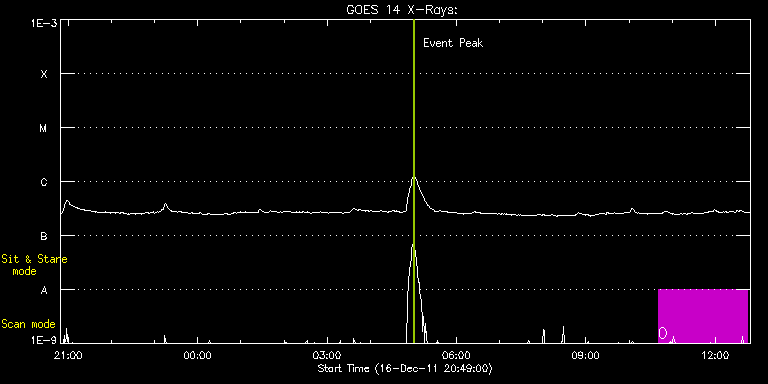
EIS Observation timeline overlay to GOES-Xray curve Code 1" 2" 40" 266" EIS Observations list for this event: STUDY ACRONYM ID DATE OBSERVED DESCRIPTION NOAA# TARGET 0 HPW021_VEL_240x512v1 | 25323 | 2011/12/17 10:40:27 | Active Region Map. AR11377. | 1377 | Active Region TIMELINE ID DATE OBSERVED FITS FILE XCEN (+W/-E) YCEN (+N/-S) DUR ----------------------------------------------------------------------------------------------------------------- 25323 | 2011/12/17 10:40:27.000 | eis_l0_20111217_104027.fits.gz | -172.02 | 219.65 | 2h3m48s : Check study information : Download file : View thumbnails For this event, also check for:
EIS Observations list for this event:
For this event, also check for:
 Hinode/EIS HomeAll Years2006 | 2007 | 2008 | 2009 | 2010 | 2011 | 2012