Hinode/EIS HomeAll Years2006 | 2007 | 2008 | 2009 | 2010 | 2011 | 2012
| Date | Begin | Max | End | Class | Location | NOAA | EIS Observations |
|---|---|---|---|---|---|---|---|
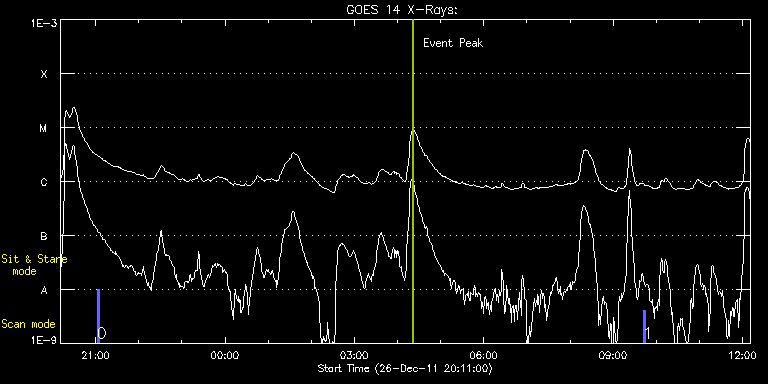
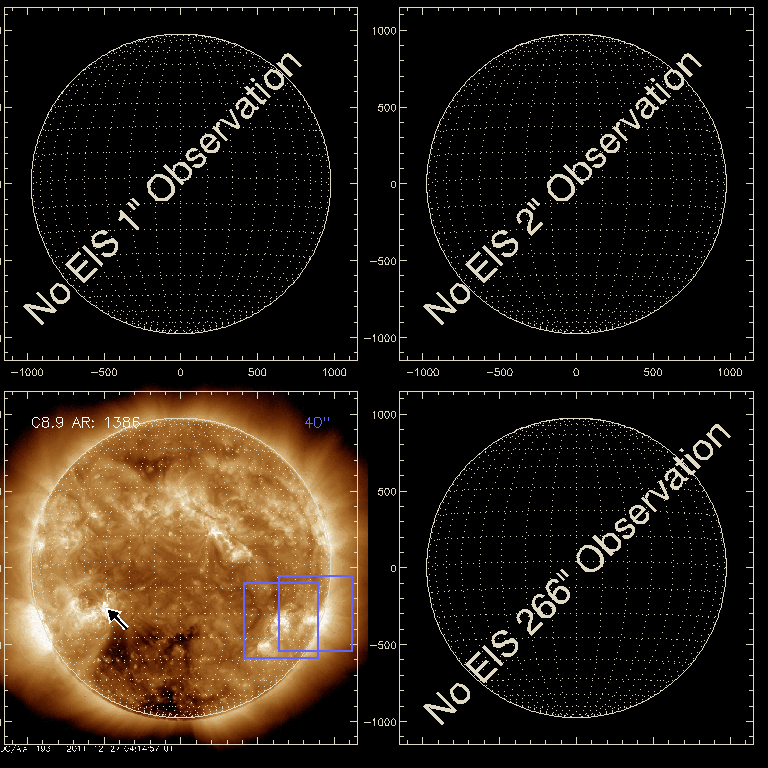
| 27-DEC-11 | 04:11 | 04:22 | 04:31 | C8.9 | S17E32 | 1386 | 20111227T0411.html |
| EIS FOV on background image (EIT/XRT/AIA full disk) | ||||||
|---|---|---|---|---|---|---|
 |
||||||
|
||||||