Hinode/EIS HomeAll Years2006 | 2007 | 2008 | 2009 | 2010 | 2011 | 2012 | 2013
| Date | Begin | Max | End | Class | Location | NOAA | EIS Observations |
|---|---|---|---|---|---|---|---|
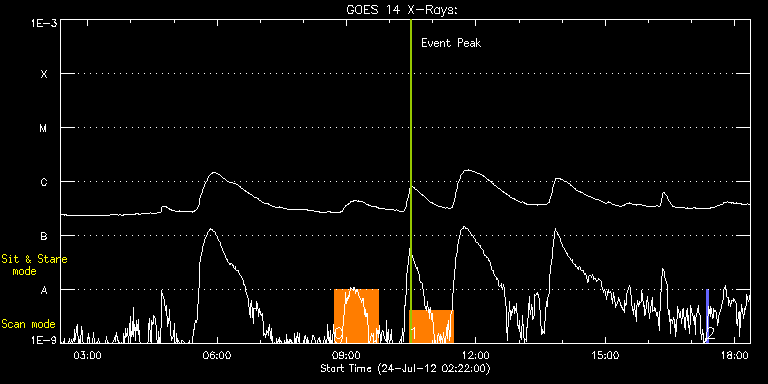
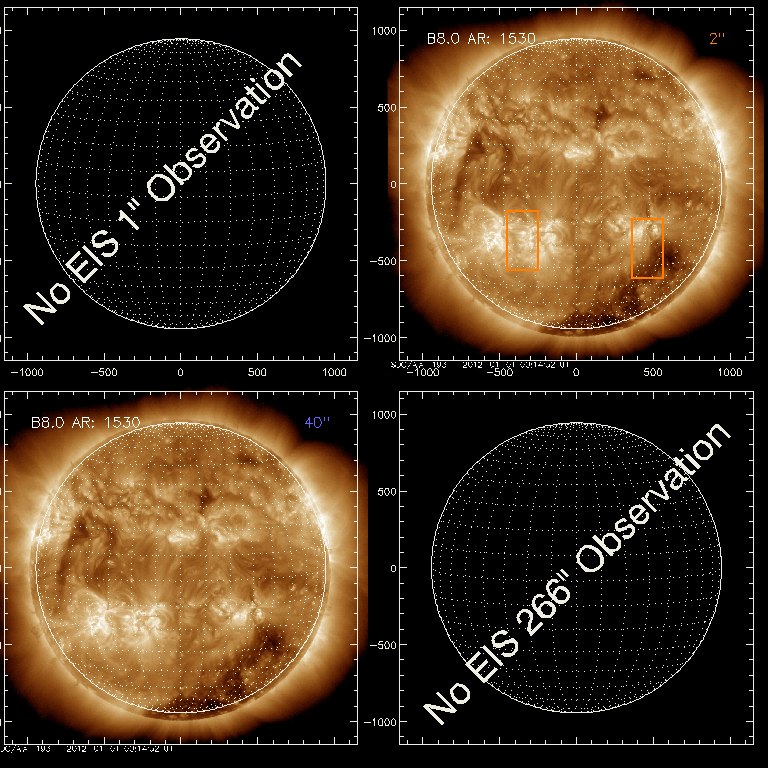
| 24-JUL-12 | 10:22 | 10:31 | 10:46 | B8.0 | 1530 | 20120724T1022.html |
| EIS FOV on background image (EIT/XRT/AIA full disk) | ||||||
|---|---|---|---|---|---|---|
 |
||||||
|
||||||