Hinode/EIS HomeAll Years2006 | 2007 | 2008 | 2009 | 2010 | 2011 | 2012 | 2013
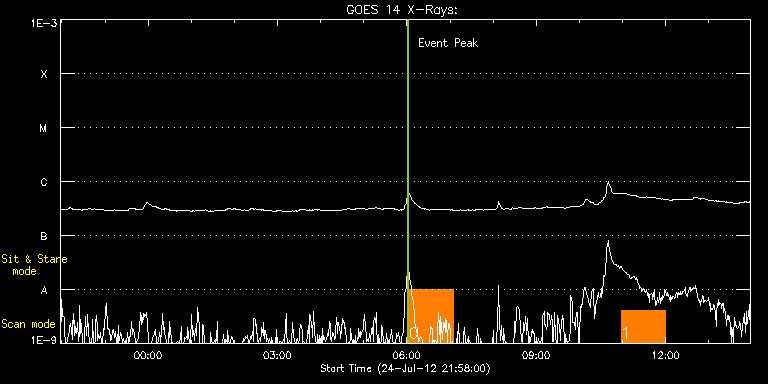
| Date | Begin | Max | End | Class | Location | NOAA | EIS Observations |
|---|---|---|---|---|---|---|---|
| 25-JUL-12 | 05:58 | 06:02 | 06:07 | B5.9 | N21E54 | 1528 | 20120725T0558.html |
| EIS FOV on background image (EIT/XRT/AIA full disk) | ||||||
|---|---|---|---|---|---|---|
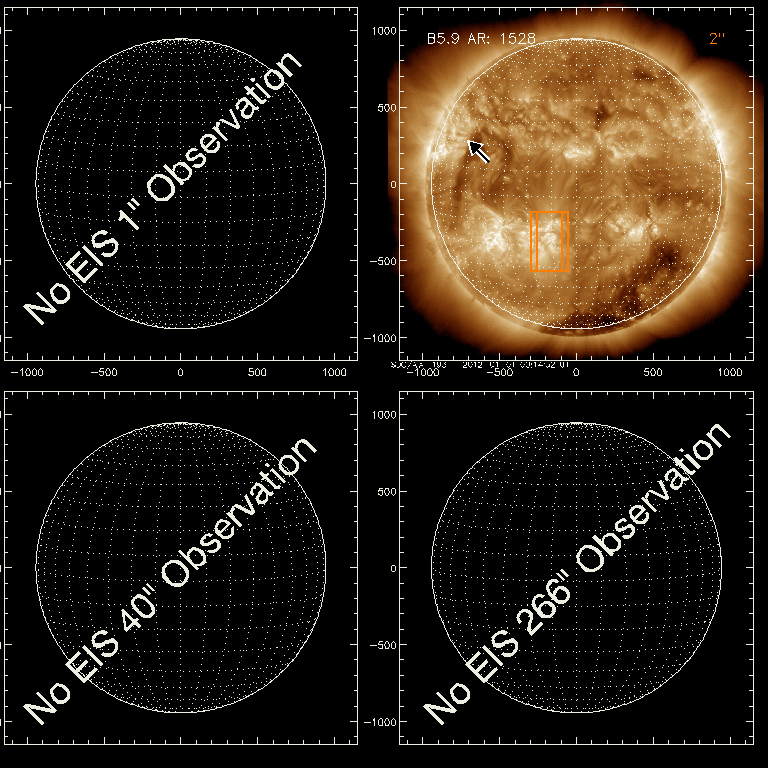 |
||||||
|
||||||