Identifying Plasma Fractionation Processes in the Chromosphere using IRIS
David Long, Deborah Baker, Andy To, Lidia van Driel-Gesztelyi, David Brooks, Marco Stangalini, Mariarita Murabito, Alexander James, Mihalis Mathioudakis, Paola Testa

The composition of the solar corona differs from that of the photosphere, with the plasma thought to fractionate in the solar chromosphere according to the First Ionisation Potential (FIP) of the different elements. This produces a FIP bias, wherein elements with a low FIP are preferentially enhanced in the corona compared to their photospheric abundance (e.g., Meyer, 1985, Asplund et al., 2009). Unlike other plasma properties such as temperature, density, and emission measure, which exhibit drastic changes in the corona, the FIP bias of a plasma is not affected by its surroundings. Instead, it is set low down in the solar atmosphere and does not change as the plasma evolves into the heliosphere, providing a key tool to relate remote-sensing and in-situ measurements of the solar corona and solar wind. As a result, it is a key plasma parameter observed by the Solar Orbiter mission (see, e.g., Muller et al., 2020; Zouganelis et al., 2020), which can be used to trace how different plasma outflows such as energetic particles (e.g., Brooks & Yardley, 2022) and the slow solar wind (e.g., Yardley et al., 2024) evolve from the Sun into the heliosphere.
Despite being the focus of intense observational and modelling research the process by which the plasma is fractionated remains unknown, although predictions made using the ponderomotive force model proposed by Laming (2004, 2009, 2015) appear to be the most consistent with observations. This model suggests that coronal Alfvén waves within coronal loops reflect and refract as they approach the higher density chromosphere and transition region, inducing a ponderomotive force which acts on ionised plasma, pulling it up into the corona and producing the observed FIP bias. However, while signatures of this process have been observed in the corona (cf. Baker et al, 2021), and photosphere/chromosphere (Stangalini et al., 2021), they remain unidentified in the upper chromosphere/transition region; the region of the solar atmosphere observed by the Interface Region Imaging Spectrograph (IRIS) spacecraft.
Observations
Our goal with this work was to try and identify signatures of the plasma fractionation process in observations made by the IRIS spacecraft. To do this, we used a series of spectroscopic observations of Active Region AR 12759 as it transited the solar disc over a period of 6 days from 2-7 April 2020 taken using the Hinode Extreme ultraviolet Imaging Spectrometer (EIS) and IRIS instruments to look for signatures of plasma fractionation in the solar chromosphere. Using the technique developed by Brooks et al. (2015) applied to the Si X / S X and Ca XIV / Ar XIV FIP bias diagnostics observed by Hinode/EIS, we found distinct differences between the FIP bias of the leading and following polarities of the active region, consistent with observations made by Baker et al. (2018) and Mihailescu et al. (2022).
The different IRIS spectral diagnostics (i.e., the Si IV, C II, and Mg II lines) were analysed in detail (cf. Figure 1) to try and identify any evidence of variation or evolution associated with the identified variation in Hinode/EIS FIP bias measurements. Although most of the diagnostics found no systematic discrepancies between the leading and following polarity regions of the active region, we found that the widths of both IRIS Si IV lines (at 1394A and 1403 A) exhibited clear differences between the leading and following polarity regions. Differences between the leading and following polarities of the active region were also identified for the chromospheric velocities derived using the Mg II lines. Finally, we also used plasma diagnostics derived using the IRIS2 inversion approach, which uses a series of representative profiles, each with an associated Representative Model Atmosphere (RMA), where the RMA was derived using the Stockholm inversion code (de la Cruz Rodríguez et al. 2019). The spectral profile in each pixel of the individual rasters is compared to a lookup table of representative profiles, with the best fit returned. This provides an estimation of the turbulence velocity (vturb), line-of-sight velocity (vLOS), electron density (ne), and temperature (T) with optical depth for each pixel in the rasters. In this case, following previous work by Testa et al. (2023), we studied the evolution of the turbulence velocity at a line-of-sight depth of t = -4.2 (see Figure 2).
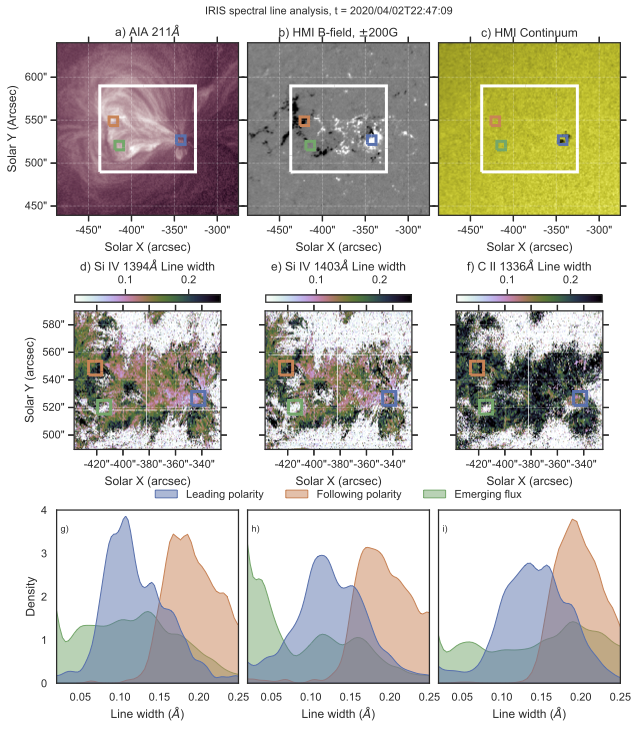
Figure 1: The plasma properties of AR 12759 at 22:47:09 UT on 2020-April-02. Panels a, b, & c show the AIA 211A, HMI line-of-sight magnetic field, and HMI continuum respectively. The white box shows the part of the IRIS raster field-of-view roughly corresponding to the core of the active region which was the primary focus of this work, with the coloured boxes showing the leading polarity (blue), following polarity (orange), and emerging flux (green) regions. Middle row shows the line width, and bottom row shows kernel density estimator (KDE) plots of the line width distributions in the three boxes for the Si IV 1394A (left), Si IV 1403A (middle), and C II 1336A (right) spectral lines. In each case, the images and plots have been limited to a range of 0.02-0.25A. Note that flux emergence had not yet started in the "emerging flux" (green) region at the time of this figure.
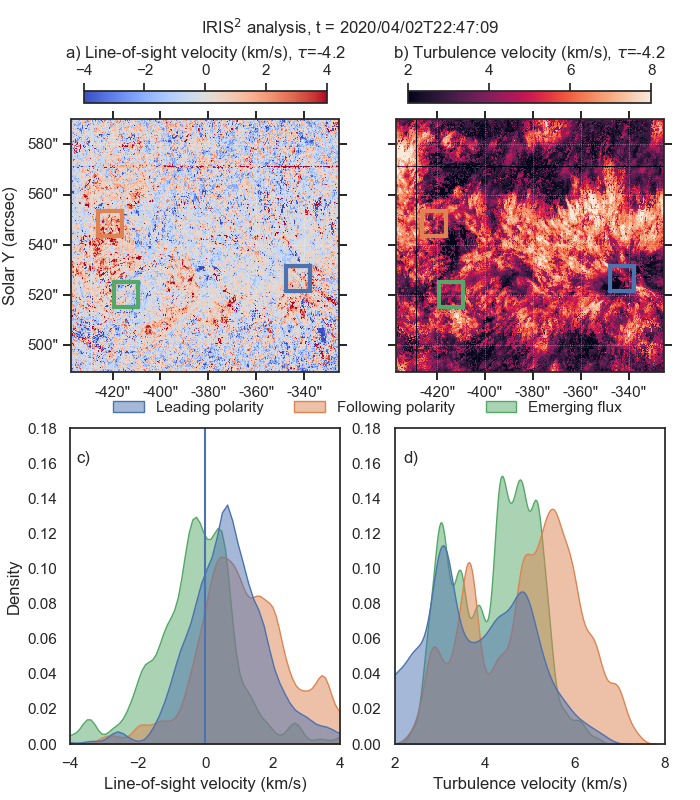
Figure 2: Derived IRIS2 properties of AR 12759 at 22:47:09 UT on 2020-April-02. Top row shows maps of (a) line-of-sight velocity, and (b) turbulence velocity, both at an optical depth t=-4.2 (cf. Testa et al., 2023). Bottom row shows the corresponding KDE plots of the pixel values within the regions of interest for each parameter. Note that flux emergence had not yet started in the ``emerging flux'' (green) region at the time of this figure.
Discussion and Conclusions
The differences in behaviour between the leading and following polarity regions of the target active region were studied using Kernel Density Estimator (KDE) plots, which provided a clear overview of the distribution of values within the defined regions of interest. The temporal evolution of these KDE plots was then used to probe the behaviour of the different diagnostics, including the evolution in Si IV line width, Mg II derived velocity gradients, and turbulence velocity derived using the IRIS2 inversion technique (cf. Sainz-Dalda et al., 2019). This is shown in Figure 3.
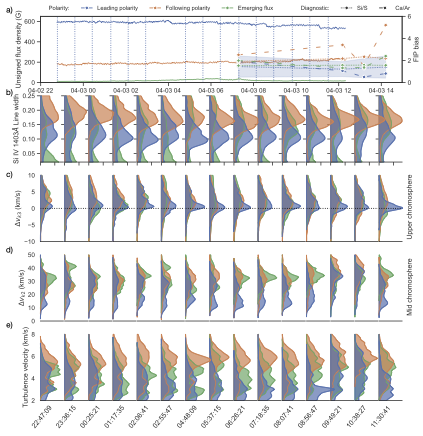
Figure 3: Panel (a) shows temporal evolution of SDO/HMI unsigned magnetic flux (solid lines) and mean Hinode/EIS FIP bias for the leading polarity (blue), following polarity (orange), and emerging flux (green) regions within the IRIS rasters identified as Group 1. FIP bias is calculated using the Si X / S X (dotted lines) and Ca XIV / Ar XIV (dashed lines) diagnostics. The blue shaded region shows the uncertainty associated with the Si X / S X ratio in the leading polarity region to provide a qualitative representation of the uncertainty associated with the FIP bias measurement. Panels (b-e) show the temporal evolution of KDE plots of Si IV 1403A line width (b), Mg II k3 velocity (c), Mg II k2 separation (d), and turbulence velocity calculated using the IRIS2 inversions at t=-4.2 (e). In each case, colours show the different regions-of-interest corresponding to panel a. Note that flux emergence had not yet started in the "emerging flux" (green) region at the time of this figure.
The leading polarity region was found to have increased mid and upper chromosphere velocity and Si IV line width, but no corresponding increase in either FIP bias diagnostic. In contrast, the following polarity region exhibited lower mid-chromosphere velocity, higher upper-chromosphere velocity, consistently high Si IV line width values, and a clear separation between the Si X / S X and Ca XIV / Ar XIV diagnostics, with the Ca XIV / Ar XIV diagnostic consistently higher in the following polarity region.
The recent paper by Mihailescu et al. (2023) found that resonant waves fractionating plasma in the upper chromosphere should produce comparable FIP bias enhancements using both the Si X / S X and Ca XIV / Ar XIV diagnostics, whereas non-resonant waves fractionating plasma in the lower chromosphere should produce significantly higher Ca XIV / Ar XIV values compared to Si X / S X. The FIP bias diagnostic values presented here are consistent with non-resonant waves fractionating plasma in the following polarity region and resonant waves fractionating the plasma in the leading polarity and emerging flux regions.
These results suggest that it is possible to identify signatures of the plasma fractionation process using observations of the chromosphere and transition region from the IRIS spacecraft. This has significant implications for our ability to probe and investigate this process given the uninterrupted observations of different phenomena within this region of the solar atmosphere made by IRIS since its launch in 2013. We look forward to further detailed analysis of these IRIS observations, and extending this analysis to include modelling and simulations in future work.
For more details, see:
Long et al., 2024, ApJ, 965:63:
Identifying Plasma Fractionation Processes in the Chromosphere using IRIS
References
Meyer, J. P. 1985, ApJS, 57, 151
Asplund, M., Grevesse, N., Sauval, A. J., & Scott, P. 2009, ARA&A, 47, 481
Müller, D., St., Cyr, O. C., Zouganelis, I., et al. 2020, A&A, 642, A1
Zouganelis, I., De Groof, A., Walsh, A. P., et al. 2020, A&A, 642, A3
Brooks, D. H. & Yardley, S. L., 2021, SciAdv, doi:10.1126/sciadv.abf0068
Yardley, S. L., Brooks, D. H., D'Amicis, R., et al, 2024, NatAst, doi:10.1038/s41550-024-02278-9
Laming, J. M. 2004, ApJ, 614, 1063
Laming, J. M. 2009, ApJ, 695, 954
Laming, J. M. 2015, LRSP, 12, 2
Baker, D., Stangalini, M., Valori, G., et al. 2021, ApJ, 907, 16
Stangalini, M., Baker, D., Valori, G., et al. 2021, RSPTA, 379, 20200216
Baker, D., Brooks, D. H., van Driel-Gesztelyi, L., et al. 2018, ApJ, 856, 71
Mihailescu, T., Brooks, D. H., Laming, J. M., et al. 2023, ApJ, 959, 72
de la Cruz Rodríguez, J., Leenaarts, J., Danilovic, S., & Uitenbroek, H. 2019, A&A, 623, A74
Testa, P., Martínez-Sykora, J., & De Pontieu, B. 2023, ApJ, 944, 117
Sainz Dalda, A., de la Cruz Rodriguez, J., De Pontieu, B., & Gosic, M. 2019,
ApJL, 875, L18
Next EIS Nugget »» coming soon...
TBC
Last Revised: 27-Oct-2011
Feedback and comments: webmaster
|


