Spectroscopic Observations of Supra-arcade Downflows
Ryan French (LASP/CU Boulder)

Supra-arcade downflows (SADs) are dark, tendril-like downflows, visible in hot channels above growing flare loop arcades. Despite their somewhat frequent appearance in extreme-ultraviolet (EUV) imaging of off-limb flares, the origins of (SADs) remain a mystery, but likely relate to outflows from the higher-altitude reconnection site (Savage et al 2011, 2012). The uncertainty of their origin is, in part, due to a lack of spectral observations, with the last published SAD spectral observations dating back to the SOHO/SUMER era in 2003 (Innes et al, 2003). In this nugget, we summarise observations (published in ApJL) of SADs within an M-class solar flare on 2022 April 2, observed by the Hinode EUV Imaging Spectrometer (EIS).
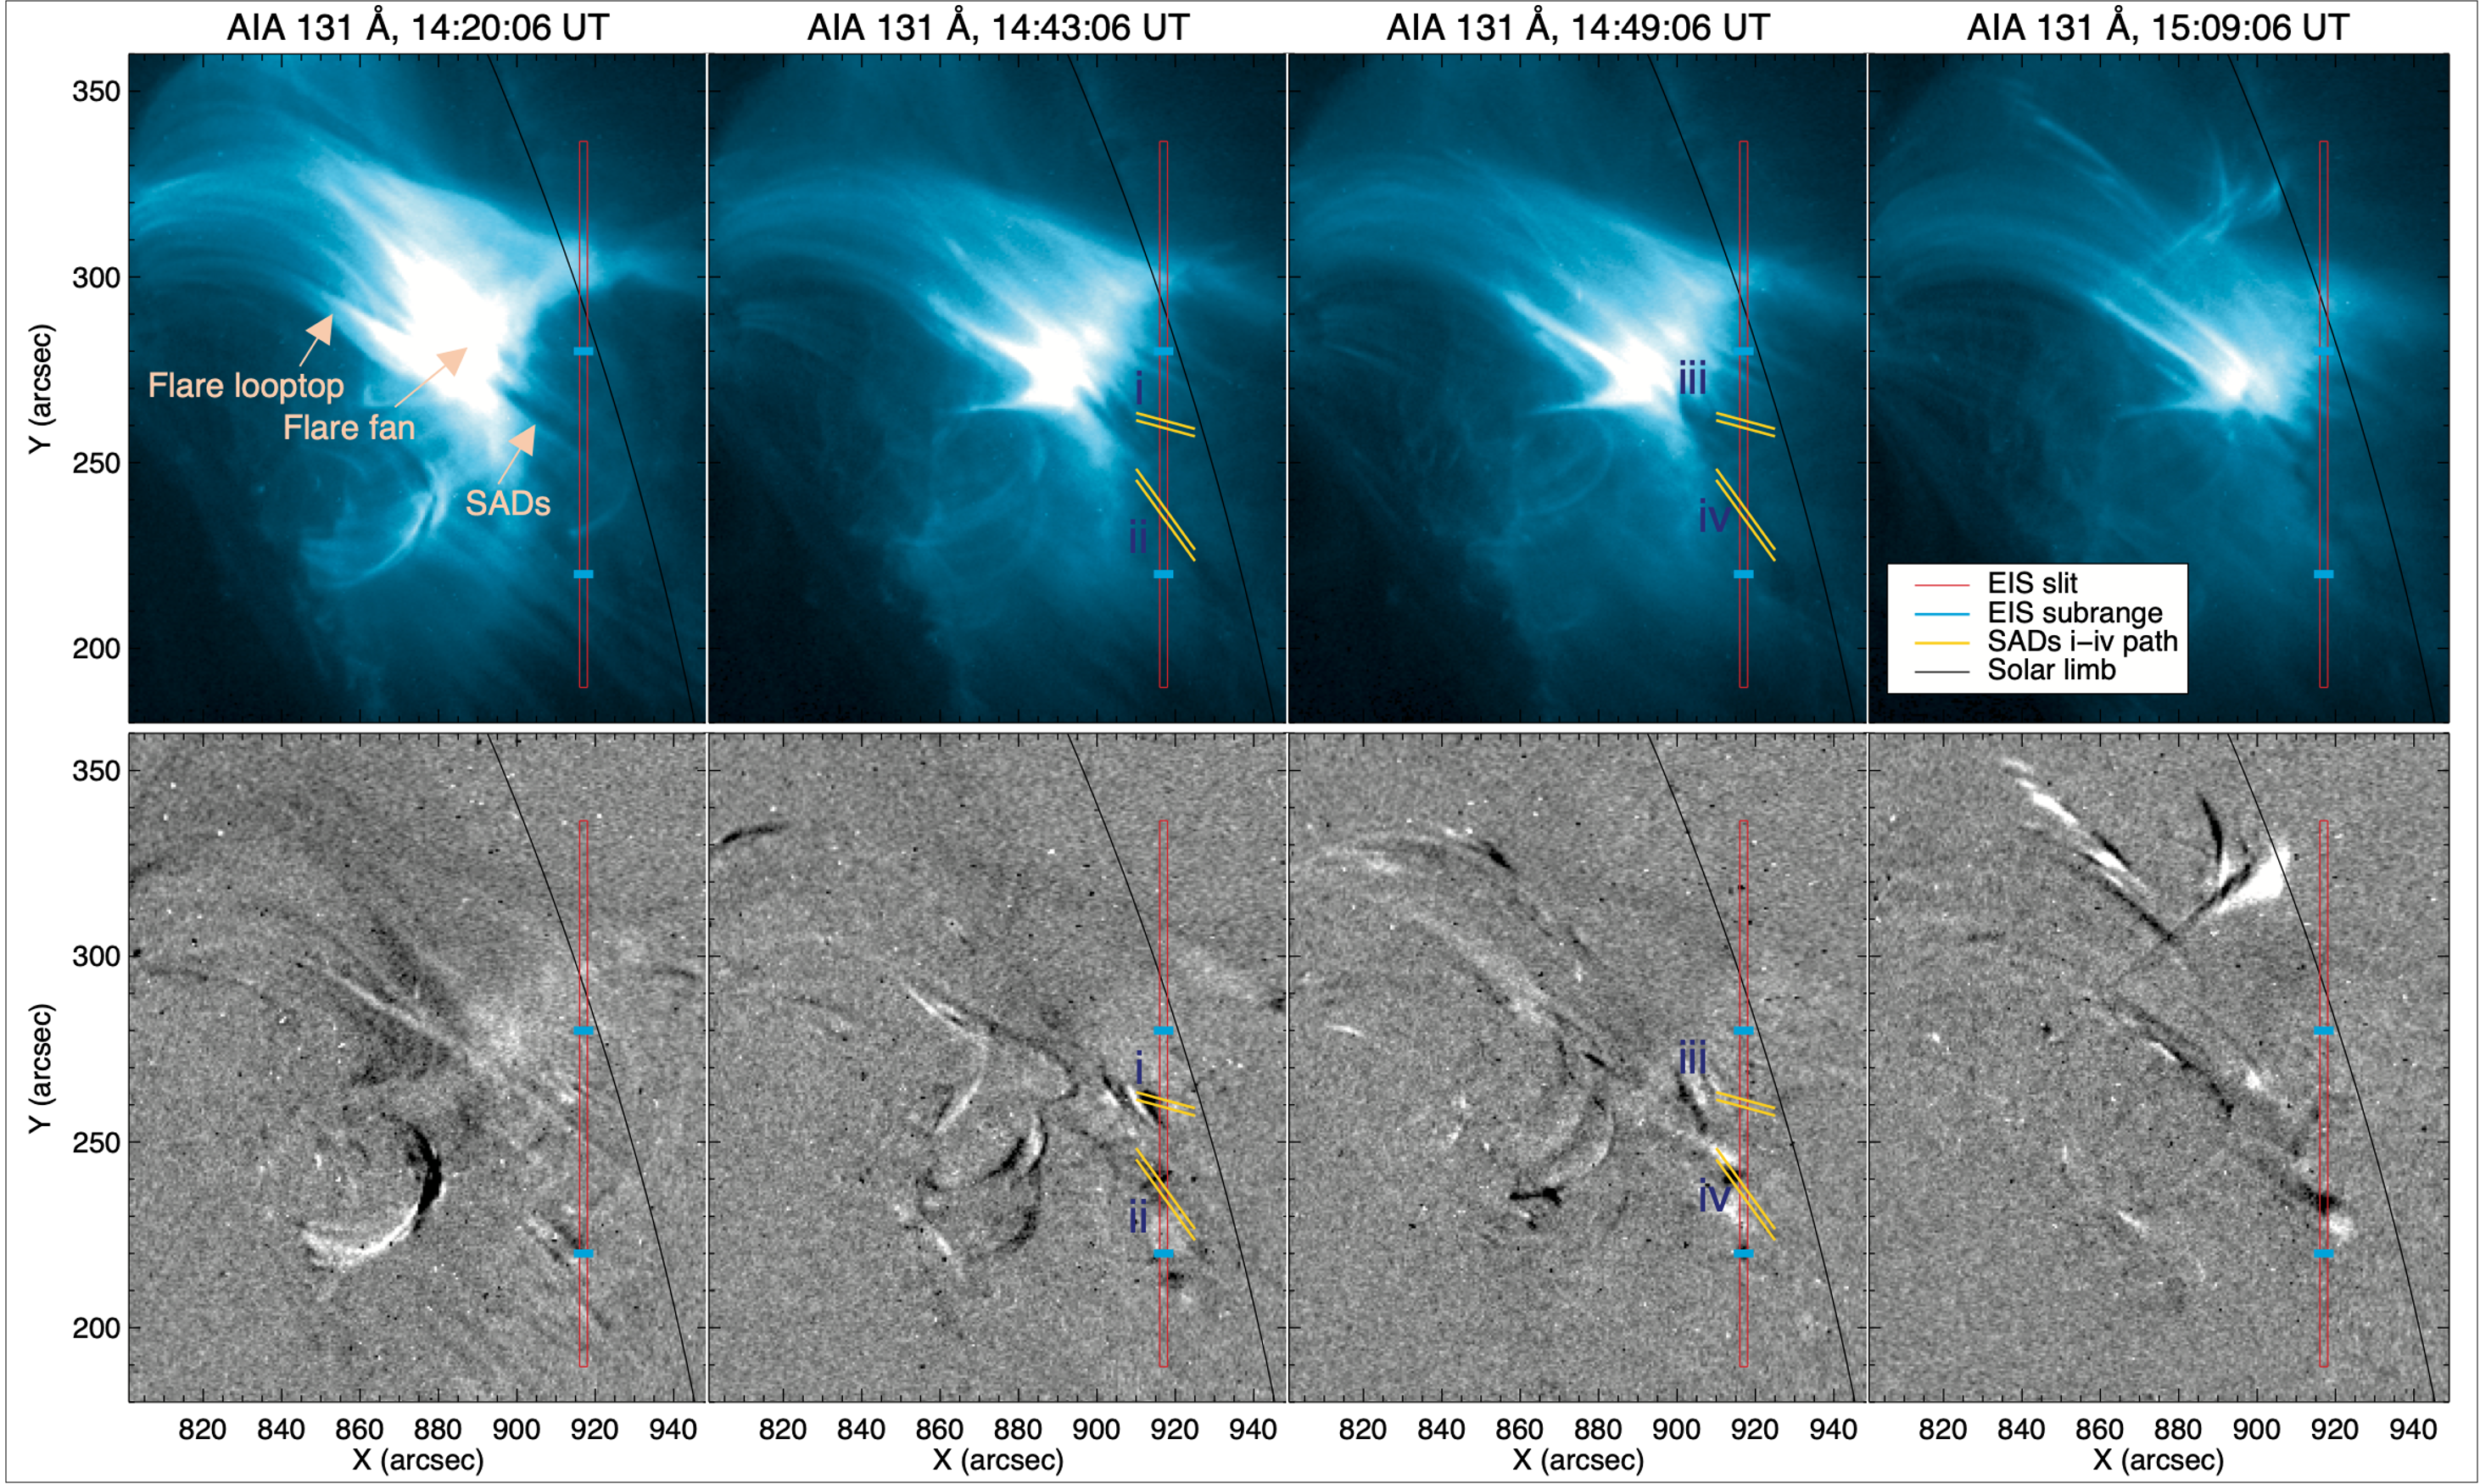
Figure 1: Top row: AIA 131 Å snapshots of the flare evolution, at times where individual supra-arcade downflow (SAD) structures cross the EIS slit. The red slit identifies the location of the sit-and-stare EIS slit, and small blue markers identify the subrange of the EIS raster analyzed in Figures 2. Bottom row: same as the top row, instead showing AIA 131 Å difference images with a 1 minute running base.
On 2022 April 2, EIS observed an M3.9-class solar flare toward the northwestern limb with a sit-and-stare sequence. Figure 1 highlights the location of the EIS sit-and-stare slit relative to the flare and solar limb, overplotted on AIA 131 Å snapshots of the flare evolution. EIS captured the full duration of the flare, including a filament eruption, late flare loop growth, and a hot supra-arcade fan. Dark streaks are visible within the flare fan, stretching from the center-right of the brightest part of each image, toward the lower-right (marked in the figure). Some of these darker structures are static, but some are dynamic-the latter of which are SADs. The second row of Figure 1 presents difference imaging (over a 1 minute running base) of the panels above. In these panels, the dynamic SADs appear black, representing the decrease in intensity created by the downflowing structures. At several times, and in multiple locations, dark SADs (seen clearly in the difference imaging panels) cross the location of the EIS slit.
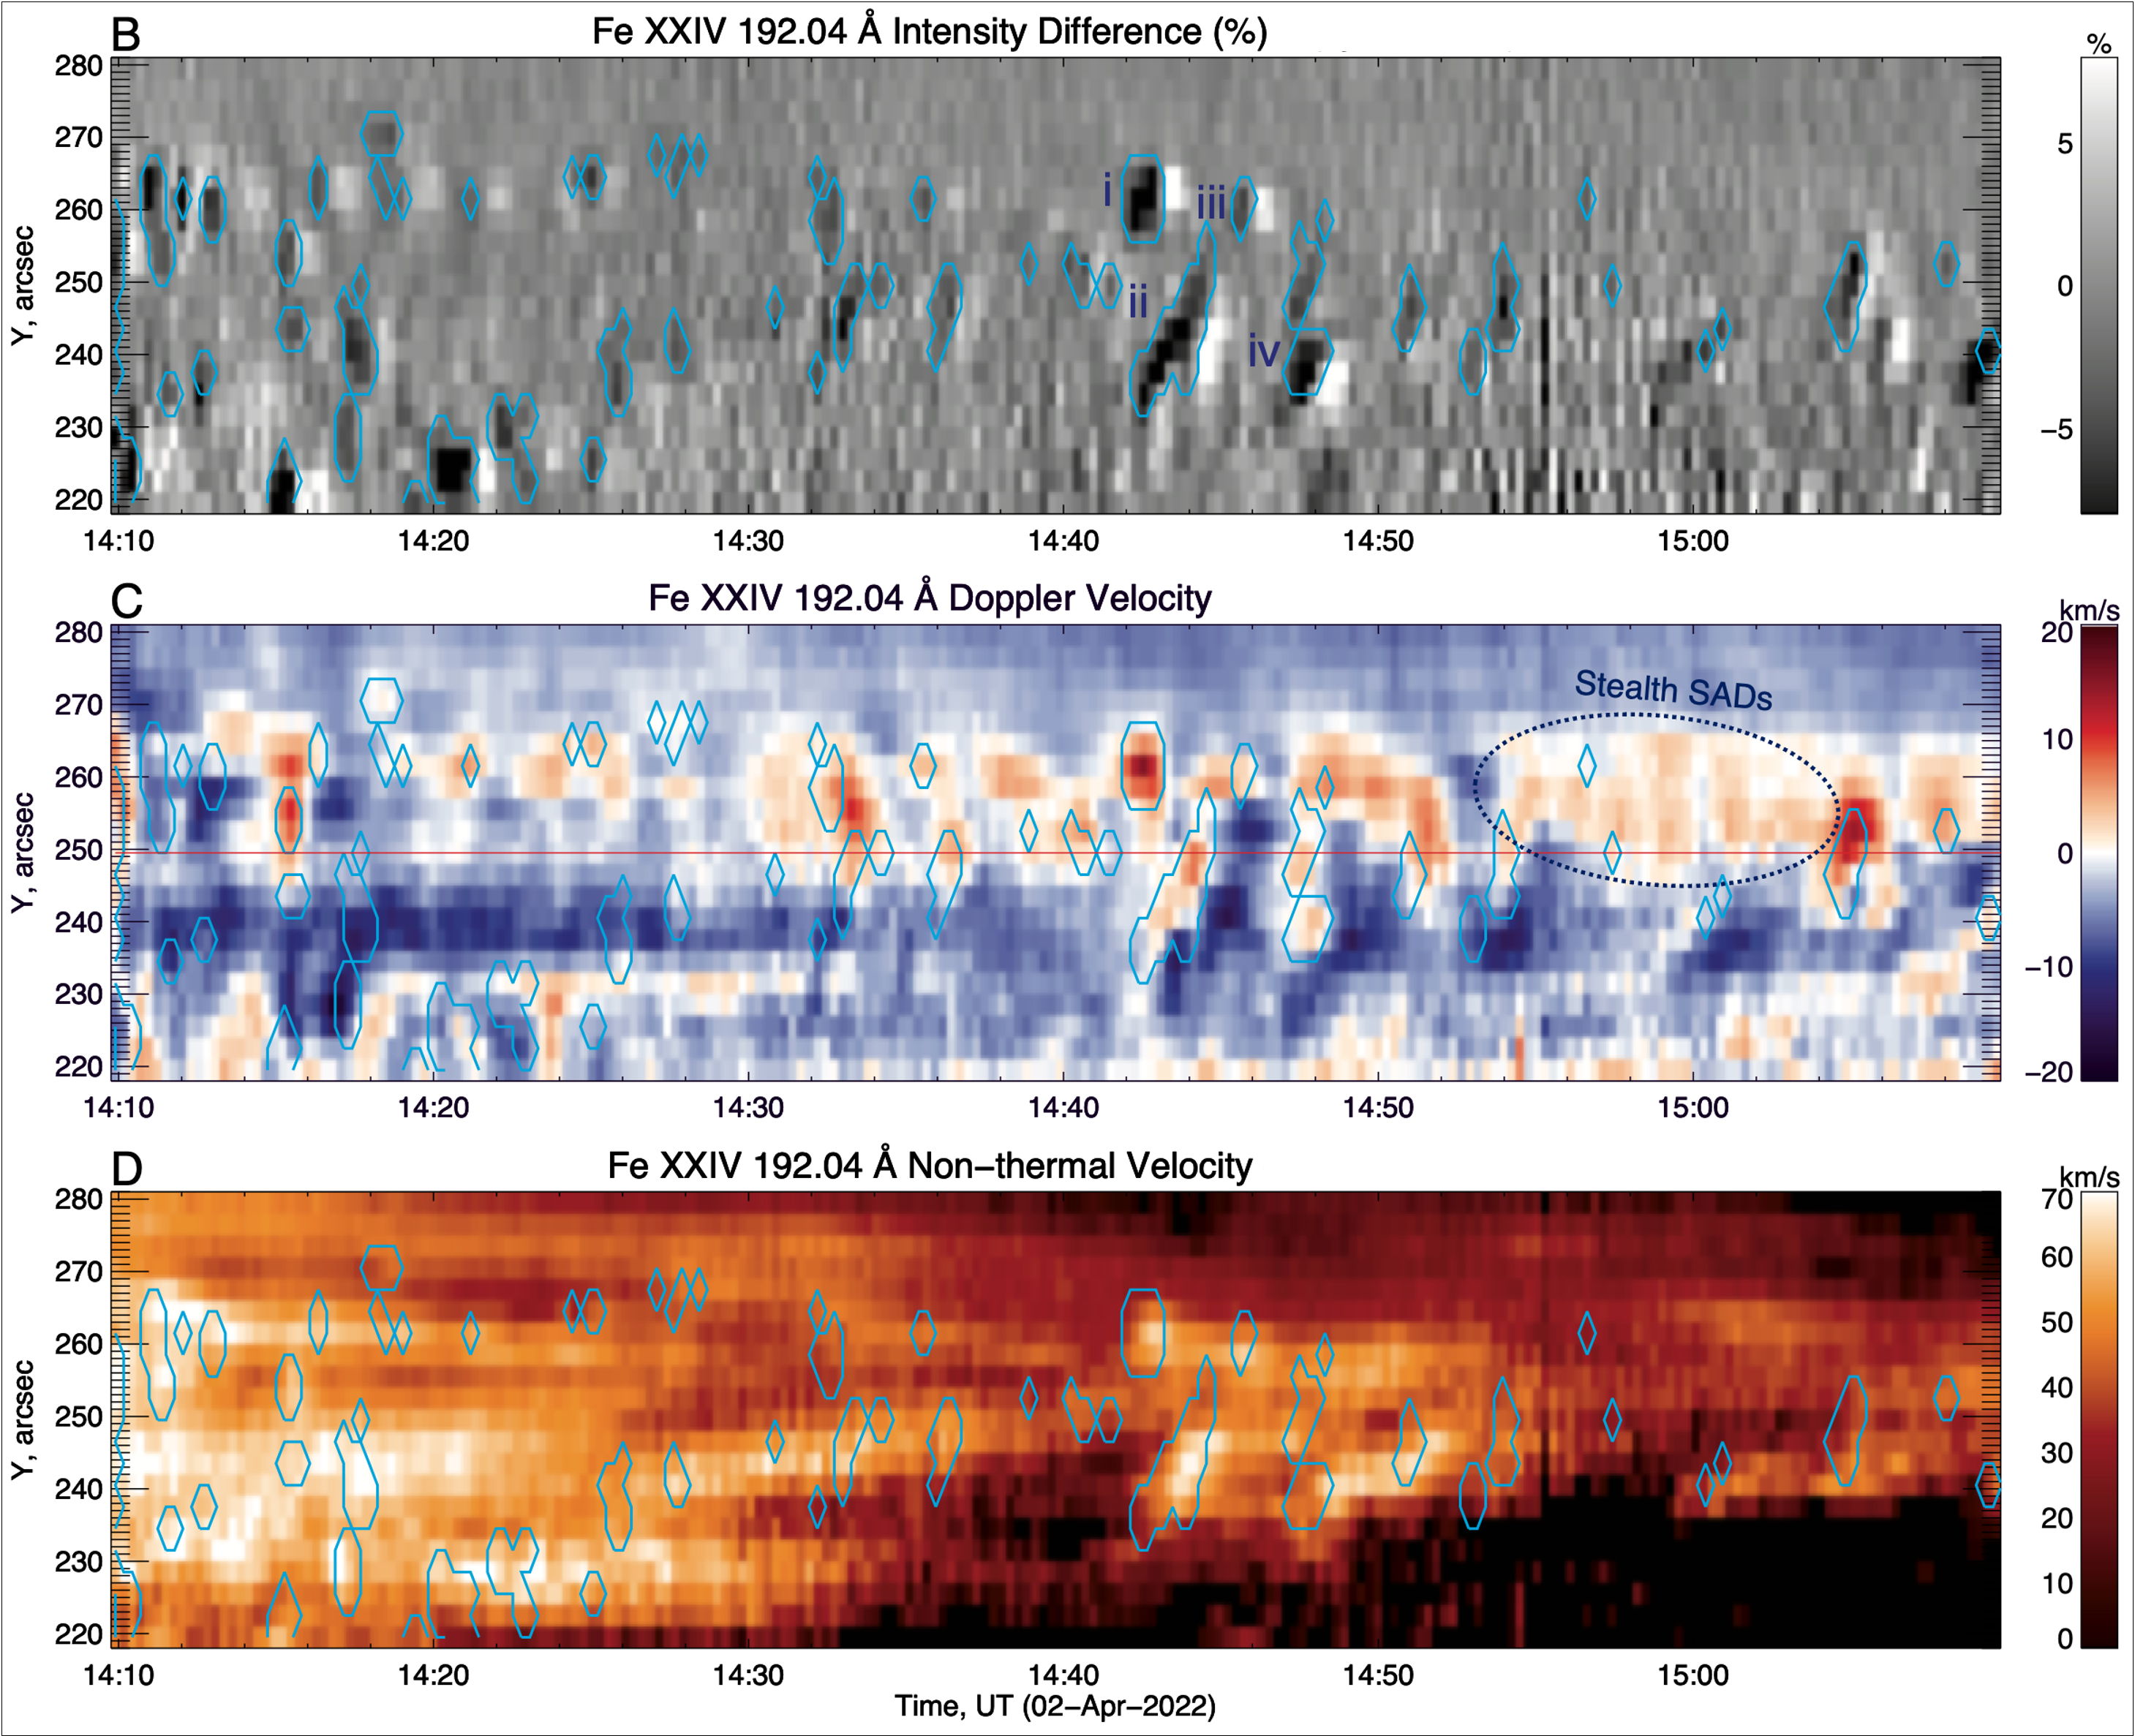
Figure 2: Panels (B)-(D): EIS Fe XXIV 192.02 Å intensity running percentage difference, Doppler velocity, and nonthermal velocity, respectively. The cyan contours mark the location of our individual SADs identified from the running difference map in panel (B).
Figure 2(A) shows the stitched sit-and-stare raster of Fe XXIV 192.02 ÅÅ intensity (difference-subtracted), line-of-sight (LOS) Doppler velocity and nonthermal velocities in the fan region, highlighting dark SADs crossing the EIS slit. We also examine temperature diagnostics using the ratio of temperature-sensitive Fe XXIV 255.11 Å and Fe XXIII 263.41 Å lines. These are the first spectroscopic measurements of SADs for twenty years. These observations provide new insights into the properties of SADs, validating earlier results and hypotheses, while providing new observables that future theory must incorporate. Our key findings are:
- In the sit-and-stare data, SADs are observed as spatially and temporally resolved drops in intensity, aligned with strong Doppler downflows (especially clear for the most prominent intensity drops). This suggests that the dark SADs themselves are downflowing, and not just low-density voids behind contracting loops.
- We see a pattern of stronger LOS downflows in the north of our region of interest than in the south. This is potentially evidence for SADs diverging beneath a high-altitude termination shock. This interpretation is not in contradiction with the interpretation that SADs are contracting loops outflowing from the reconnection site, but can explain the disparity between SAD velocities and the local Alfvén speed in the lower solar corona; as the reconnection outflows are slowed down by the termination shock region.
- Statistically, the SADs exhibit higher nonthermal velocities than seen in the surrounding flare fan. The highest-contrast SADs show a time lag between intensity drop and nonthermal velocity enhancement, which persists beyond the SADs passage across the slit location. This is in support of previous works suggesting SADs produce and are comprised of turbulent plasma.
- We find SAD temperatures in the range of 12.2-13.4 MK, close to that of the surrounding flare fan. These are in line with earlier temperature measurements from DEM analysis.
- We compare LOS velocity measurements from EIS with POS velocity measurements from AIA imaging construct to the 3D velocity field of four SADs to find velocities primarily constrained in the POS, with magnitudes similar to those found in previous imaging studies. We find no evidence of more rapid velocities, such as the 800-1000 km/s downflows observed in Innes et al, 2003.
- As per item 1, the dark SADs correspond spatially to redshift structures. However, equivalent Doppler features, near identical in appearance to those produced by SADs, also exist elsewhere in the raster, at times and locations with no corresponding intensity drops in either the EIS intensity raster or AIA pseudo-raster. This suggests the existence of `stealth SADs'-downflowing SAD structures that produce no observable drop in intensity.
The observations presented in this nugget (and in the full publication) allow the validation of previous interpretations of SADs, while also revealing new behaviors that must be incorporated into future theory and modeling. These findings include the spatial alignment between intensity drops and Doppler velocity enhancements in SADs, a divergence of SADs above the flare loop top, the turbulent nature of SADs, verifying previous SAD imaging temperature measurements, and the existence of `stealth SADs.' Despite their elusive nature, the likely connection between SADs, the flare reconnection site, and possible high-altitude termination shock means they continue to offer potential insights into the fundamental energy release and particle acceleration processes in solar flares.
For more details, see:
French et al., ApJL, 986, no. 1, 2025
Spectroscopic Observations of Supra-arcade Downflows
References
Innes D. E., McKenzie D. E. and Wang T. 2003b SoPh 217, 267
Savage S. L. and McKenzie D. E. 2011 ApJ 730, 98
Savage S. L., McKenzie D. E. and Reeves K. K. 2012 ApJL 747, L40
Next EIS Nugget »» coming soon...
TBC
Last Revised: 27-Oct-2011
Feedback and comments: webmaster
|


